 1
 2
 3
 4
 5
 6
 7
 8
 9
10
11
12
13
14
15
16
17
18
19
20
21
|
# Spring Boot 项目集成 Prometheus 监控指南

## 1. 依赖配置

在 `build.gradle` 中添加必要依赖:

```gradle
dependencies {
    // 基础依赖
    implementation 'org.springframework.boot:spring-boot-starter-web'
    implementation 'org.springframework.boot:spring-boot-starter-actuator'

    // Prometheus 监控
    implementation 'io.micrometer:micrometer-registry-prometheus'
    implementation 'io.prometheus:simpleclient:0.16.0'
    implementation 'io.prometheus:simpleclient_hotspot:0.16.0'

    // Pulsar 相关(可选)
    implementation "org.apache.pulsar:pulsar-client:4.0.3"
    implementation "org.apache.pulsar:pulsar-client-admin:4.0.3"
}
|
2. 应用配置
在 application.yml 中配置:
 1
 2
 3
 4
 5
 6
 7
 8
 9
10
11
12
13
14
15
16
17
18
|
spring:
  application:
    name: AutomateJobTest

management:
  endpoints:
    web:
      base-path: /actuator
      exposure:
        include: health,info,prometheus
      path-mapping:
        prometheus: metrics  # 可选:将端点改为/metrics
  metrics:
    tags:
      application: ${spring.application.name}  # 统一标签命名
    export:
      prometheus:
        enabled: true
|
3. 自定义指标实现
创建自定义指标类:
 1
 2
 3
 4
 5
 6
 7
 8
 9
10
11
12
13
14
15
|
@Component
public class CustomMetrics {
    private final Counter requestCounter;

    public CustomMetrics(MeterRegistry registry) {
        requestCounter = Counter.builder("api.requests.count")
                .description("API请求计数")
                .tag("application", "AutomateJobTest")
                .register(registry);
    }

    public void increment() {
        requestCounter.increment();
    }
}
|
4. Prometheus 服务端配置
在k8s的configmap中配置prometheus
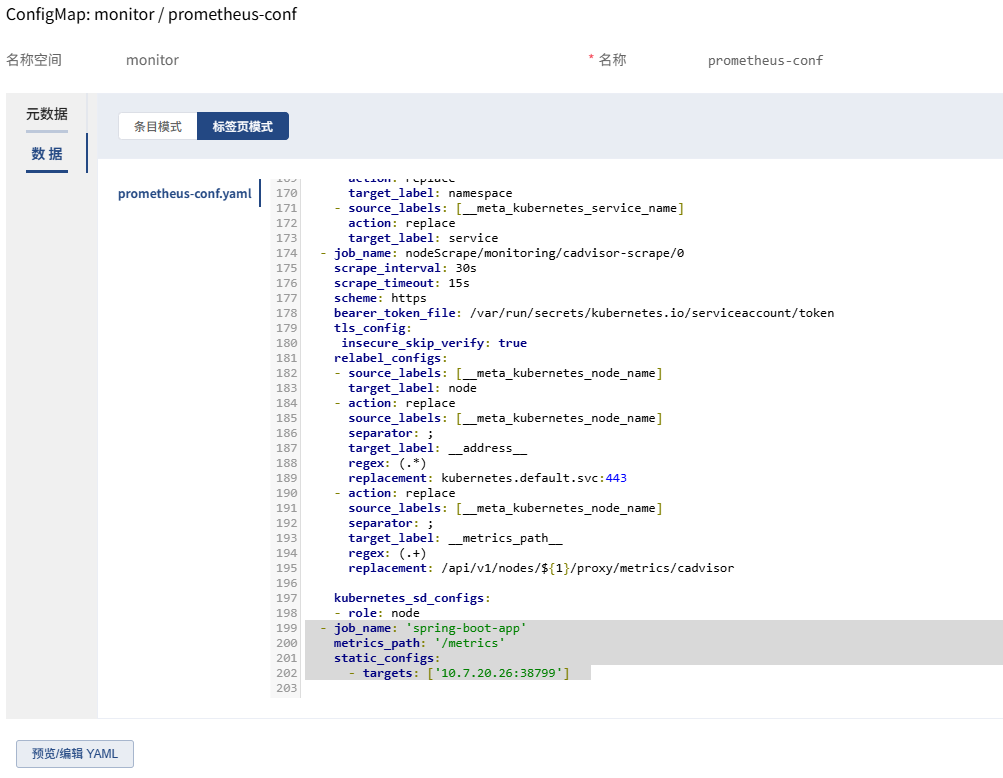 我们可以使用kubernetes-pod来采集这个数据
 1
 2
 3
 4
 5
 6
 7
 8
 9
10
11
12
13
14
15
16
17
18
19
20
21
22
23
24
25
26
27
28
29
|
- job_name: 'kubernetes-pods'
    kubernetes_sd_configs:
    - role: pod
    relabel_configs:
    - source_labels: [__meta_kubernetes_pod_annotation_prometheus_io_application]
      target_label: application
    - source_labels: [__meta_kubernetes_pod_annotation_prometheus_io_scrape]
      action: keep
      regex: true
    - source_labels: [__meta_kubernetes_pod_annotation_prometheus_io_path]
      action: replace
      target_label: __metrics_path__
      regex: (.+)
    - source_labels: [__address__, __meta_kubernetes_pod_annotation_prometheus_io_port]
      action: replace
      regex: ([^:]+)(?::\d+)?;(\d+)
      replacement: $1:$2
      target_label: __address__
    - action: labelmap
      regex: __meta_kubernetes_pod_label_(.+)
    - source_labels: [__meta_kubernetes_namespace]
      action: replace
      target_label: kubernetes_namespace
    - source_labels: [__meta_kubernetes_pod_label_component]
      action: replace
      target_label: job
    - source_labels: [__meta_kubernetes_pod_name]
      action: replace
      target_label: kubernetes_pod_name
|
需要注意,在pod下的template下需要添加注解,让prometheus来采集,如下图所示
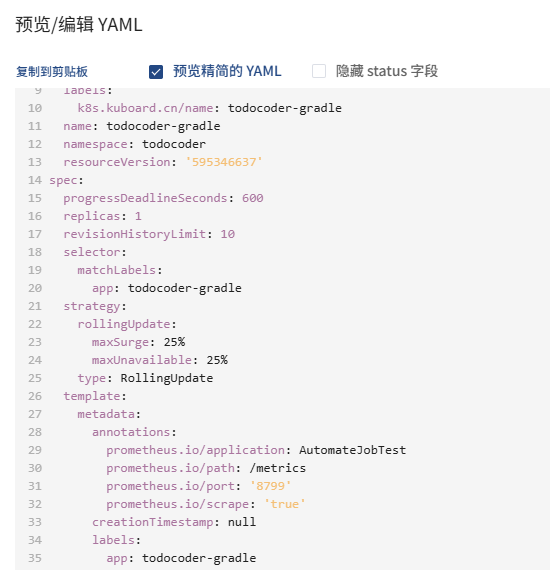 注意这个prometheus.io/application 这个key是为了让prometheus来升成application这个值,否在grafana的dashboard无法正常展示,我们在prometheus上可以正常查看到这个数据。
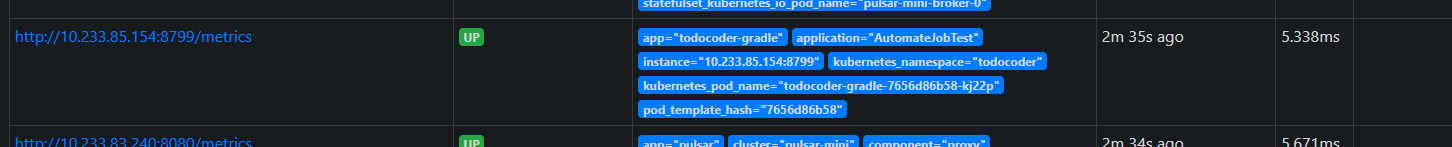
 如上图所示,可以看到application的名称。
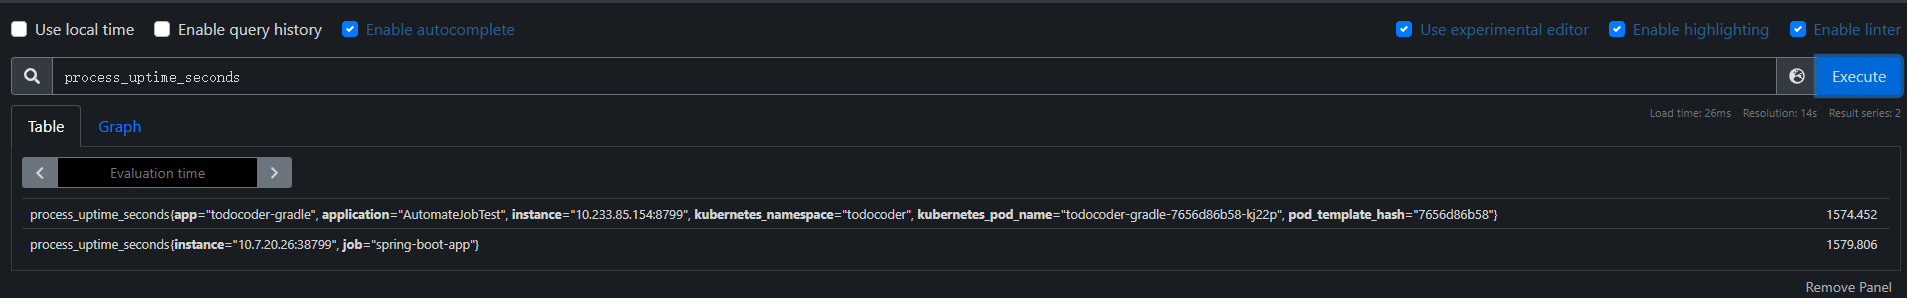
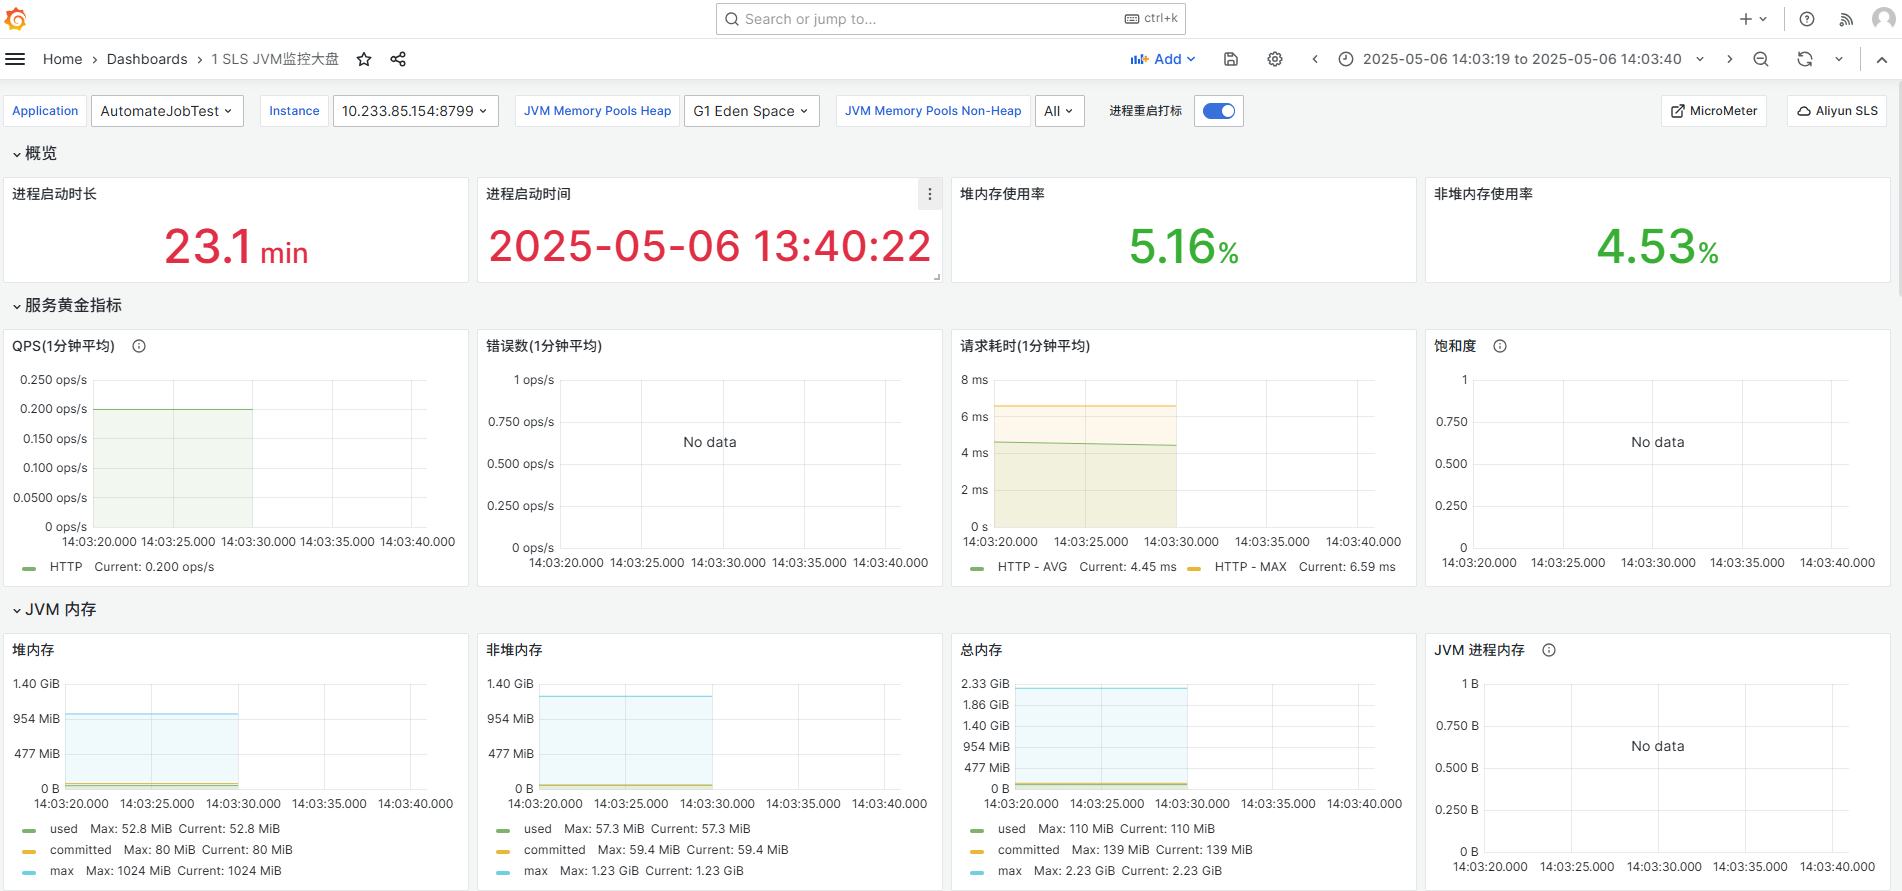
查看dashboard:
如上图所示,可以看到application的名称。
查看dashboard:
 1
 2
 3
 4
 5
 6
 7
 8
 9
10
11
12
13
14
15
16
17
18
19
20
21
22
23
24
25
26
27
28
29
30
31
|
# Spring Boot 自定义 Prometheus 指标指南

## 1. 背景介绍

Spring Boot 默认提供的 Prometheus 监控指标可能无法满足特定业务需求,因此需要自定义指标。Prometheus 通过主动拉取方式获取指标数据,我们只需提供符合格式的自定义指标接口即可。

## 2. 依赖配置

在 `pom.xml` 中添加以下依赖:

```xml
<!-- 基础 Prometheus 客户端 -->
<dependency>
    <groupId>io.prometheus</groupId>
    <artifactId>simpleclient</artifactId>
    <version>0.16.0</version>
</dependency>

<!-- JVM 监控指标 -->
<dependency>
    <groupId>io.prometheus</groupId>
    <artifactId>simpleclient_hotspot</artifactId>
    <version>0.16.0</version>
</dependency>

<!-- HTTP Servlet 支持 -->
<dependency>
    <groupId>io.prometheus</groupId>
    <artifactId>simpleclient_servlet</artifactId>
    <version>0.16.0</version>
</dependency>
|
3. 实现自定义指标
3.1 创建指标服务类
 1
 2
 3
 4
 5
 6
 7
 8
 9
10
11
12
13
14
15
16
|
import io.prometheus.client.Gauge;
import org.springframework.stereotype.Service;

@Service
public class CustomMetricsService {

    // 创建Gauge类型指标
    private final Gauge customGauge = Gauge.build()
            .name("custom_metric_demo")
            .help("This is a custom gauge metric")
            .register();

    public void updateMetric(double value) {
        customGauge.set(value);
    }
}
|
3.2 创建指标暴露端点
 1
 2
 3
 4
 5
 6
 7
 8
 9
10
11
12
13
14
|
import io.prometheus.client.exporter.MetricsServlet;
import org.springframework.boot.web.servlet.ServletRegistrationBean;
import org.springframework.context.annotation.Bean;
import org.springframework.context.annotation.Configuration;

@Configuration
public class PrometheusConfig {

    @Bean
    public ServletRegistrationBean<MetricsServlet> metricsServlet() {
        return new ServletRegistrationBean<>(
            new MetricsServlet(), "/metrics");
    }
}
|
4. 验证指标
启动应用后访问 /metrics 端点,将看到类似输出:
1
2
3
|
# HELP custom_metric_demo This is a custom gauge metric
# TYPE custom_metric_demo gauge
custom_metric_demo 0.0
|
5. Kubernetes 集成配置
5.1 创建 ServiceMonitor
 1
 2
 3
 4
 5
 6
 7
 8
 9
10
11
12
13
14
15
16
17
18
|
apiVersion: monitoring.coreos.com/v1
kind: ServiceMonitor
metadata:
  labels:
    k8s-app: my-app-monitor
  name: my-app-monitor
  namespace: my-namespace
spec:
  endpoints:
    - interval: 30s
      port: http
      path: /metrics
  selector:
    matchLabels:
      app: my-springboot-app
  namespaceSelector:
    matchNames:
      - my-namespace
|
5.2 关键参数说明
| 参数 |
说明 |
interval |
Prometheus 抓取间隔 |
port |
服务暴露的端口名称 |
path |
指标暴露路径 |
matchLabels |
匹配目标 Service 的标签 |