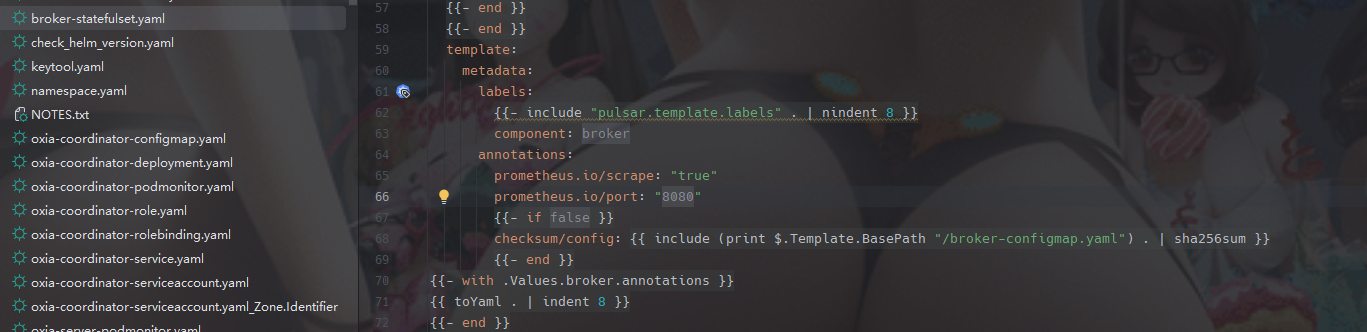
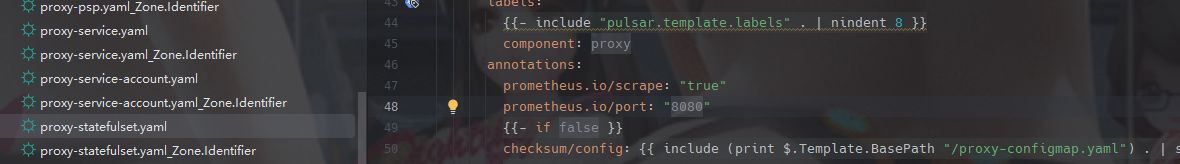
pulsar这个repo是直接支持抓取数据给prometheus中,因为在他的manifetst中都支持了数据的抓取,如下图所示:
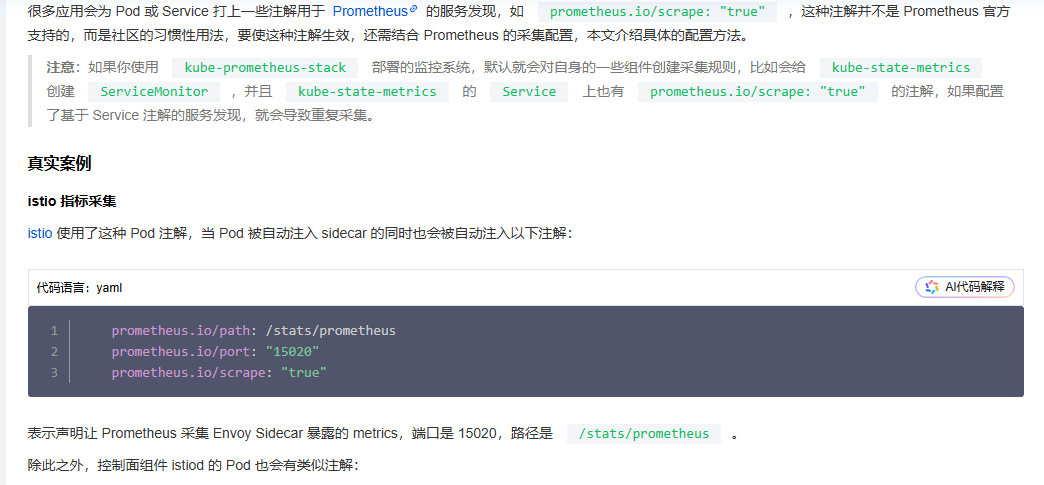
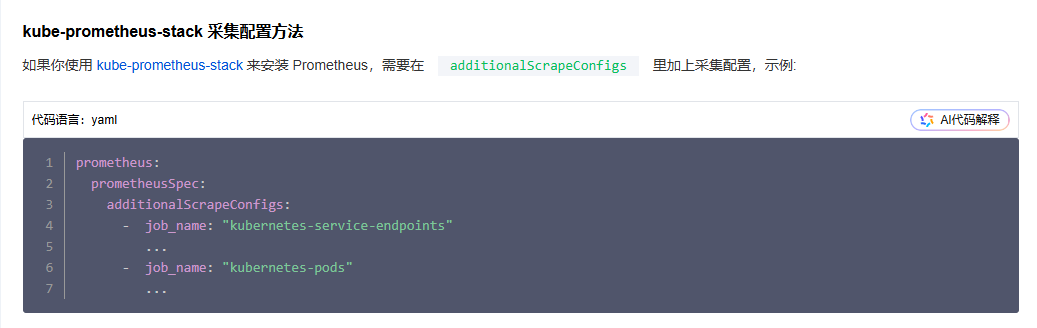
 注意要让prometheus能采集到这些数据,需要查询prometheus的job是否以下数据:
内容的位置如上图所见的,内容如下所示,这样才可以在prometheus端口访问到这些数据
 1
 2
 3
 4
 5
 6
 7
 8
 9
10
11
12
13
14
15
16
17
18
19
20
21
22
23
24
25
26
27
28
29
30
31
32
33
34
35
36
37
38
39
40
41
42
43
44
45
46
47
48
49
50
51
52
53
54
55
56
57
58
59
60
61
62
63
64
65
66
67
68
69
70
71
72
73
74
75
76
77
78
79
80
81
82
83
84
85
86
|
  - job_name: "kubernetes-pods"
    kubernetes_sd_configs:
    - role: pod

    relabel_configs:
    - source_labels:
          - __meta_kubernetes_pod_label_component
      action: replace
      target_label: job
    # prometheus relabel to scrape only pods that have
    # `prometheus.io/scrape: "true"` annotation.
    - source_labels:
        - __meta_kubernetes_pod_annotation_prometheus_io_scrape
      action: keep
      regex: true

    # prometheus relabel to customize metric path based on pod
    # `prometheus.io/path: <metric path>` annotation.
    - source_labels:
        - __meta_kubernetes_pod_annotation_prometheus_io_path
      action: replace
      target_label: __metrics_path__
      regex: (.+)
    # prometheus relabel to scrape only single, desired port for the pod
    # based on pod `prometheus.io/port: <port>` annotation.
    - source_labels:
        - __address__
        - __meta_kubernetes_pod_annotation_prometheus_io_port
      action: replace
      regex: ([^:]+)(?::\d+)?;(\d+)
      replacement: $1:$2
      target_label: __address__
    - action: labelmap
      regex: __meta_kubernetes_pod_label_(.+)
    - source_labels: [__meta_kubernetes_namespace]
      action: replace
      target_label: namespace
    - source_labels: [__meta_kubernetes_pod_name]
      action: replace
      target_label: pod
  - job_name: "kubernetes-service-endpoints"

    kubernetes_sd_configs:
     - role: endpoints

    relabel_configs:
    # prometheus relabel to scrape only endpoints that have
    # `prometheus.io/scrape: "true"` annotation.
    - source_labels:
        - __meta_kubernetes_service_annotation_prometheus_io_scrape
      action: keep
      regex: true

    # prometheus relabel to customize metric path based on endpoints
    # `prometheus.io/path: <metric path>` annotation.
    - source_labels:
        - __meta_kubernetes_service_annotation_prometheus_io_path
      action: replace
      target_label: __metrics_path__
      regex: (.+)

    # prometheus relabel to scrape only single, desired port for the service based
    # on endpoints `prometheus.io/port: <port>` annotation.
    - source_labels:
        - __address__
        - __meta_kubernetes_service_annotation_prometheus_io_port
      action: replace
      regex: ([^:]+)(?::\d+)?;(\d+)
      replacement: $1:$2
      target_label: __address__

    # prometheus relabel to configure scrape scheme for all service scrape targets
    # based on endpoints `prometheus.io/scheme: <scheme>` annotation.
    - source_labels:
        - __meta_kubernetes_service_annotation_prometheus_io_scheme
      action: replace
      target_label: __scheme__
      regex: (https?)
    - action: labelmap
      regex: __meta_kubernetes_service_label_(.+)
    - source_labels: [__meta_kubernetes_namespace]
      action: replace
      target_label: namespace
    - source_labels: [__meta_kubernetes_service_name]
      action: replace
      target_label: service
|
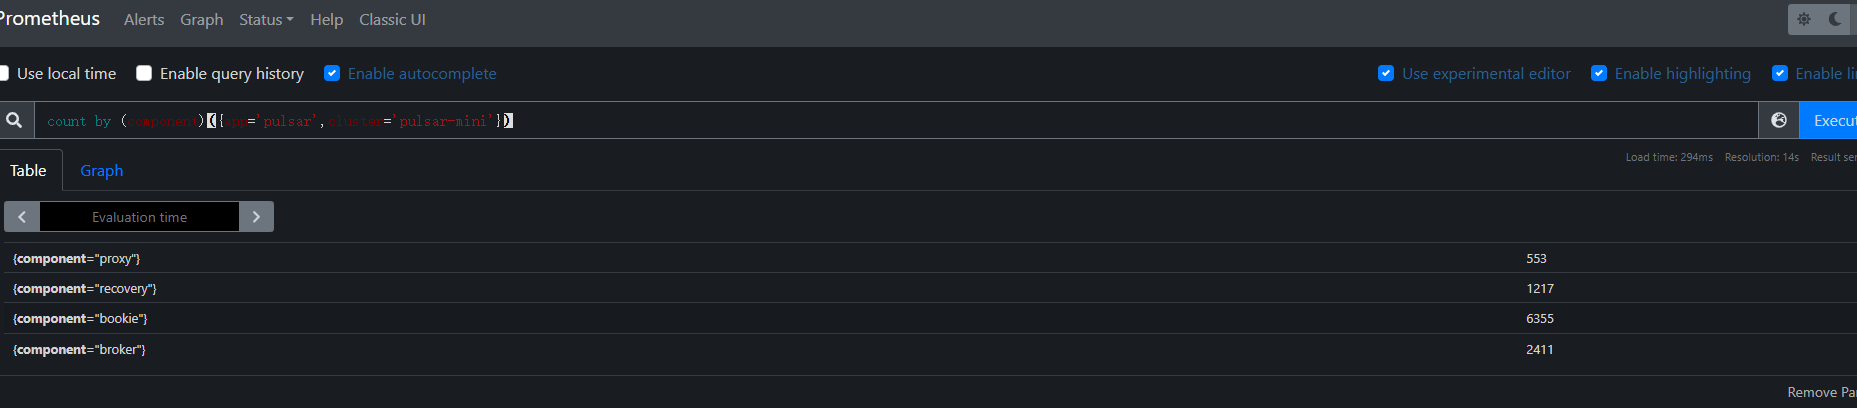
上面配置生效后可以在prometheus界面看到如下内容:
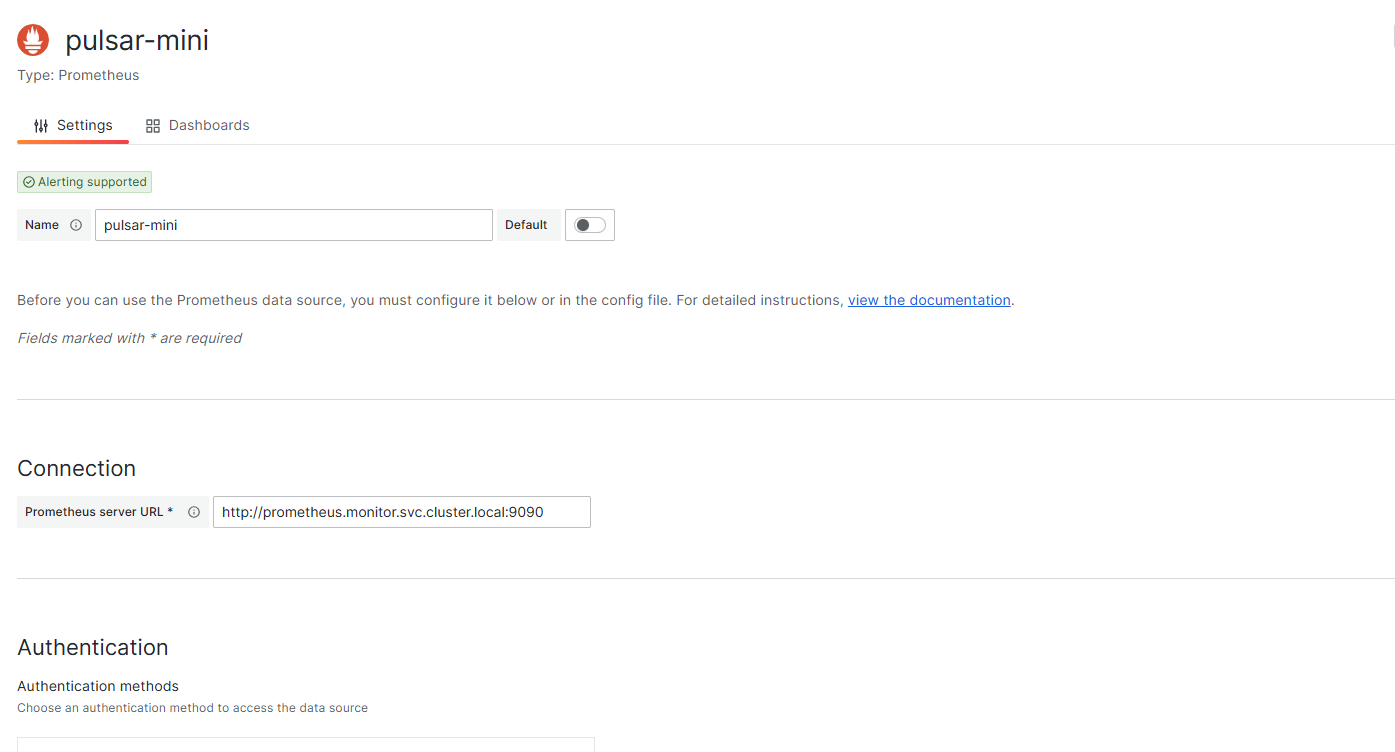
 注意接下来是要配置grafana
第一步datasource配置:
注意接下来是要配置grafana
第一步datasource配置:
接下来生成一下dashboard文件:
1
2
3
|
git clone git@github.com:streamnative/apache-pulsar-grafana-dashboard.git
cd apache-pulsar-grafana-dashboard
./scripts/generate_dashboards.sh <prometheus-url> <clustername>
|
<prometheus-url 就是我们的prometheus的地址
clustername 就是helm安装的pulsar的名称
执行这个命令成功后,就可以在target目录下看到升成文件
 1
 2
 3
 4
 5
 6
 7
 8
 9
10
11
12
13
14
15
16
17
18
19
20
21
22
|
tree -L 2 target
target
├── dashboards
│   ├── bookkeeper.json
│   ├── broker.json
│   ├── functions.json
│   ├── jvm.json
│   ├── kop.json
│   ├── loadbalance.json
│   ├── logs.json
│   ├── messaging.json
│   ├── node.json
│   ├── overview.json
│   ├── proxy.json
│   ├── pulsar_detector.json
│   ├── topic.json
│   ├── transaction.json
│   ├── zookeeper-3.6.json
│   └── zookeeper.json
├── datasources
│   └── pulsar.yml
└── datasources.yml
|
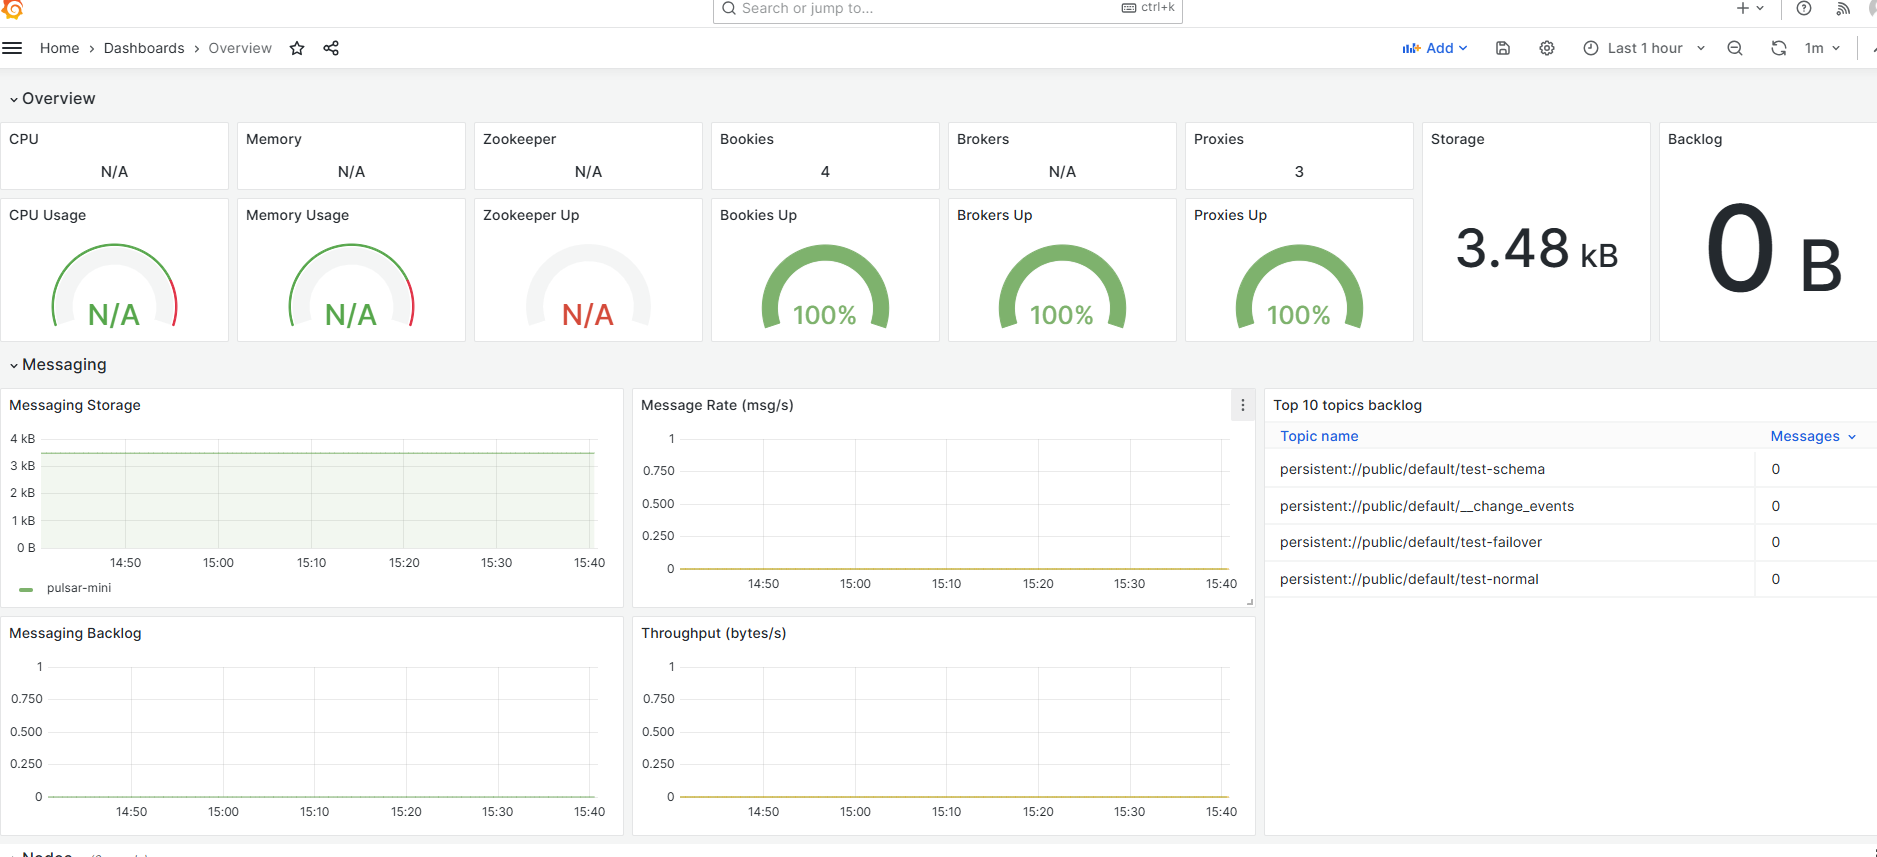
导入到dashboard中后看看效果:
注意这次遇到我的单元测试用例一直过不去,后来发现是token选择错了,选择了proxy-admin的token,这个token带来的问题就是 pulsar的日志中出现了 invliad role的报错,查询资料,发现是因为proxy-admin是代理角色,不能后直接传到后台中,会引发报错,接下来引入copolot的解释:::
在Apache Pulsar中,出现“Invalid Role”或与“origin角色”相关的问题,通常与身份验证和授权配置有关。以下是一些可能的原因和解释:
-
代理角色配置问题:
- 如果您使用代理(proxy)连接到Pulsar集群,代理角色(proxy role)和原始角色(origin role)的配置必须正确。
- Pulsar要求
originalPrincipal(原始角色)不能是代理角色。如果代理角色和原始角色配置冲突,例如两者都被设置为同一个角色名,可能会导致“Invalid Role”错误。
-
缺少原始角色:
- 当通过代理连接时,Pulsar需要提供
originalPrincipal,即客户端的原始身份。如果未提供,或者提供的值为空,可能会触发错误。
-
授权规则不匹配:
- 如果代理角色没有被正确授权访问某些资源,或者原始角色没有被正确映射到代理角色,也可能导致连接失败。
-
配置文件问题:
- 在Pulsar的配置文件中,例如
broker.conf或proxy.conf,需要确保superUserRoles和proxyRoles字段正确配置。如果这些字段中包含冲突或不正确的角色定义,可能会引发问题。
-
TLS或JWT身份验证问题:
- 如果您使用TLS或JWT进行身份验证,可能会因为证书或令牌的配置错误而导致角色验证失败。
解决方法可能包括:
- 检查并确保
proxyRoles和superUserRoles的配置正确。
- 确保
originalPrincipal的值符合Pulsar的要求。
- 如果使用Helm Chart部署,检查相关的YAML文件是否正确配置。
- 查看Pulsar的日志文件,定位具体的错误信息。
如果您能提供更多的上下文或具体的错误日志,我可以帮助您更详细地分析问题!
这里需要思考一个问题,pulsar设计这个权限的原因了,这是可能是为了pulsar的多租户而这么做的,这才是他的目的:
好的,作为Pulsar的设计者之一,我可以解释为什么它设置了这些角色机制,尽管表面看似增加了复杂度,但背后是有深刻的设计考量的。
1. 分离职责,增强安全性
Pulsar采用角色和权限的机制,主要是为了分离不同组件的职责,从而提升系统的安全性。例如:
- 代理角色 (Proxy Role) 和 原始角色 (Origin Role) 是为了解决客户端和代理之间的身份链问题。代理通过扮演“中介”的角色,将原始客户端的真实身份传递给Pulsar。
- 使用这种设计可以防止未经授权的代理冒充合法客户端。这种角色分离防止了权限滥用,确保资源访问有严格的控制。
2. 支持多租户场景
Pulsar本身是为多租户架构设计的,这意味着多个用户(或组织)可以在同一集群中隔离运行并共享资源。通过角色机制:
- 每个租户都有独立的权限控制,不会干扰其他租户。
- 角色定义可以确保不同租户的资源访问权限不会冲突。
3. 灵活扩展性
角色和权限的灵活性使得Pulsar能够适应不同的场景需求。例如:
- 对于简单应用,可以直接使用默认的权限和角色。
- 对于复杂的企业需求,角色可以映射到LDAP组、OAuth身份等,从而无缝集成现有的企业系统。
4. 适配多种安全机制
角色机制允许Pulsar在各种身份验证方法(如JWT、TLS证书等)中灵活切换。虽然复杂度有所增加,但它提供了极高的兼容性,使用户可以根据实际需求选择最佳的认证方案。
5. 遵循安全最佳实践
Pulsar实现了最小权限原则(Principle of Least Privilege)。通过明确划分代理角色和原始角色的权限,可以确保代理只能执行其被授权的操作,而不会拥有过多的权限。这种设计虽然需要用户更多的配置,但从长期看能显著降低潜在的安全风险。
总结:
这些角色的设计初衷并不是为了增加复杂度,而是为了在多租户、分布式、高安全性需求下保持灵活性和扩展性。虽然初学者可能会觉得上手稍显复杂,但这种机制在实际生产环境中提供了极大的好处和保障。
如果换成您是用户,我会这么解释:“复杂,是为了更高效、更安全的运行,牺牲了一些学习曲线换取了长远的可靠性和灵活性。” 您觉得这样的解释可以吗? 😊好的,作为Pulsar的设计者之一,我可以解释为什么它设置了这些角色机制,尽管表面看似增加了复杂度,但背后是有深刻的设计考量的。
1. 分离职责,增强安全性
Pulsar采用角色和权限的机制,主要是为了分离不同组件的职责,从而提升系统的安全性。例如:
- 代理角色 (Proxy Role) 和 原始角色 (Origin Role) 是为了解决客户端和代理之间的身份链问题。代理通过扮演“中介”的角色,将原始客户端的真实身份传递给Pulsar。
- 使用这种设计可以防止未经授权的代理冒充合法客户端。这种角色分离防止了权限滥用,确保资源访问有严格的控制。
2. 支持多租户场景
Pulsar本身是为多租户架构设计的,这意味着多个用户(或组织)可以在同一集群中隔离运行并共享资源。通过角色机制:
- 每个租户都有独立的权限控制,不会干扰其他租户。
- 角色定义可以确保不同租户的资源访问权限不会冲突。
3. 灵活扩展性
角色和权限的灵活性使得Pulsar能够适应不同的场景需求。例如:
- 对于简单应用,可以直接使用默认的权限和角色。
- 对于复杂的企业需求,角色可以映射到LDAP组、OAuth身份等,从而无缝集成现有的企业系统。
4. 适配多种安全机制
角色机制允许Pulsar在各种身份验证方法(如JWT、TLS证书等)中灵活切换。虽然复杂度有所增加,但它提供了极高的兼容性,使用户可以根据实际需求选择最佳的认证方案。
5. 遵循安全最佳实践
Pulsar实现了最小权限原则(Principle of Least Privilege)。通过明确划分代理角色和原始角色的权限,可以确保代理只能执行其被授权的操作,而不会拥有过多的权限。这种设计虽然需要用户更多的配置,但从长期看能显著降低潜在的安全风险。
总结:
这些角色的设计初衷并不是为了增加复杂度,而是为了在多租户、分布式、高安全性需求下保持灵活性和扩展性。虽然初学者可能会觉得上手稍显复杂,但这种机制在实际生产环境中提供了极大的好处和保障。
如果换成您是用户,我会这么解释:“复杂,是为了更高效、更安全的运行,牺牲了一些学习曲线换取了长远的可靠性和灵活性。” 您觉得这样的解释可以吗? 😊
配置监控告警规则 #
可以为Pulsar集群配置Prometheus的监控告警规则,这里的监控告警规则参考了https://github.com/streamnative/examples/blob/master/platform/values_cluster.yaml中的例子。
  1
  2
  3
  4
  5
  6
  7
  8
  9
 10
 11
 12
 13
 14
 15
 16
 17
 18
 19
 20
 21
 22
 23
 24
 25
 26
 27
 28
 29
 30
 31
 32
 33
 34
 35
 36
 37
 38
 39
 40
 41
 42
 43
 44
 45
 46
 47
 48
 49
 50
 51
 52
 53
 54
 55
 56
 57
 58
 59
 60
 61
 62
 63
 64
 65
 66
 67
 68
 69
 70
 71
 72
 73
 74
 75
 76
 77
 78
 79
 80
 81
 82
 83
 84
 85
 86
 87
 88
 89
 90
 91
 92
 93
 94
 95
 96
 97
 98
 99
100
101
102
103
104
105
106
107
108
109
110
111
112
113
114
115
116
117
118
119
120
121
122
123
124
125
126
127
128
129
130
131
132
133
134
135
136
137
138
139
140
141
142
|
groups:
  2- name: zookeeper
  3  rules:
  4  - alert: HighWatchers
  5    expr: zookeeper_server_watches_count{job="zookeeper"} > 1000000
  6    for: 30s
  7    labels:
  8      status: warning
  9    annotations:
 10      summary: "Watchers of Zookeeper server is over than 1000k."
 11      description: "Watchers of Zookeeper server {{ $labels.instance }} is over than 1000k, current value is {{ $value }}."
 12
 13  - alert: HighEphemerals
 14    expr: zookeeper_server_ephemerals_count{job="zookeeper"} > 10000
 15    for: 30s
 16    labels:
 17      status: warning
 18    annotations:
 19      summary: "Ephemeral nodes of Zookeeper server is over than 10k."
 20      description: "Ephemeral nodes of Zookeeper server {{ $labels.instance }} is over than 10k, current value is {{ $value }}."
 21
 22  - alert: HighConnections
 23    expr: zookeeper_server_connections{job="zookeeper"} > 10000
 24    for: 30s
 25    labels:
 26      status: warning
 27    annotations:
 28      summary: "Connections of Zookeeper server is over than 10k."
 29      description: "Connections of Zookeeper server {{ $labels.instance }} is over than 10k, current value is {{ $value }}."
 30
 31  - alert: HighDataSize
 32    expr: zookeeper_server_data_size_bytes{job="zookeeper"} > 107374182400
 33    for: 30s
 34    labels:
 35      status: warning
 36    annotations:
 37      summary: "Data size of Zookeeper server is over than 100TB."
 38      description: "Data size of Zookeeper server {{ $labels.instance }} is over than 100TB, current value is {{ $value }}."
 39
 40  - alert: HighRequestThroughput
 41    expr: sum(irate(zookeeper_server_requests{job="zookeeper"}[30s])) by (type) > 1000
 42    for: 30s
 43    labels:
 44      status: warning
 45    annotations:
 46      summary: "Request throughput on Zookeeper server is over than 1000 in 30 seconds."
 47      description: "Request throughput of {{ $labels.type}} on Zookeeper server {{ $labels.instance }} is over than 1k, current value is {{ $value }}."
 48
 49  - alert: HighRequestLatency
 50    expr: zookeeper_server_requests_latency_ms{job="zookeeper", quantile="0.99"} > 100
 51    for: 30s
 52    labels:
 53      status: warning
 54    annotations:
 55      summary: "Request latency on Zookeeper server is over than 100ms."
 56      description: "Request latency {{ $labels.type }} in p99 on Zookeeper server {{ $labels.instance }} is over than 100ms, current value is {{ $value }} ms."
 57
 58- name: bookie
 59  rules:
 60  - alert: HighEntryAddLatency
 61    expr: bookkeeper_server_ADD_ENTRY_REQUEST{job="bookie", quantile="0.99", success="true"} > 100
 62    for: 30s
 63    labels:
 64      status: warning
 65    annotations:
 66      summary: "Entry add latency is over than 100ms"
 67      description: "Entry add latency on bookie {{ $labels.instance }} is over than 100ms, current value is {{ $value }}."
 68
 69  - alert: HighEntryReadLatency
 70    expr: bookkeeper_server_READ_ENTRY_REQUEST{job="bookie", quantile="0.99", success="true"} > 1000
 71    for: 30s
 72    labels:
 73      status: warning
 74    annotations:
 75      summary: "Entry read latency is over than 1s"
 76      description: "Entry read latency on bookie {{ $labels.instance }} is over than 1s, current value is {{ $value }}."
 77
 78- name: broker
 79  rules:
 80  - alert: StorageWriteLatencyOverflow
 81    expr: pulsar_storage_write_latency{job="broker"} > 1000
 82    for: 30s
 83    labels:
 84      status: danger
 85    annotations:
 86      summary: "Topic write data to storage latency overflow is more than 1000."
 87      description: "Topic {{ $labels.topic }} is more than 1000 messages write to storage latency overflow , current value is {{ $value }}."
 88
 89  - alert: TooManyTopics
 90    expr: sum(pulsar_topics_count{job="broker"}) by (cluster) > 1000000
 91    for: 30s
 92    labels:
 93      status: warning
 94    annotations:
 95      summary: "Topic count are over than 1000000."
 96      description: "Topic count in cluster {{ $labels.cluster }} is more than 1000000 , current value is {{ $value }}."
 97
 98  - alert: TooManyProducersOnTopic
 99    expr: pulsar_producers_count > 10000
100    for: 30s
101    labels:
102      status: warning
103    annotations:
104      summary: "Producers on topic are more than 10000."
105      description: "Producers on topic {{ $labels.topic }} is more than 10000 , current value is {{ $value }}."
106
107  - alert: TooManySubscriptionsOnTopic
108    expr: pulsar_subscriptions_count > 100
109    for: 30s
110    labels:
111      status: warning
112    annotations:
113      summary: "Subscriptions on topic are more than 100."
114      description: "Subscriptions on topic {{ $labels.topic }} is more than 100 , current value is {{ $value }}."
115
116  - alert: TooManyConsumersOnTopic
117    expr: pulsar_consumers_count > 10000
118    for: 30s
119    labels:
120      status: warning
121    annotations:
122      summary: "Consumers on topic are more than 10000."
123      description: "Consumers on topic {{ $labels.topic }} is more than 10000 , current value is {{ $value }}."
124
125  - alert: TooManyBacklogsOnTopic
126    expr: pulsar_msg_backlog > 50000
127    for: 30s
128    labels:
129      status: warning
130    annotations:
131      summary: "Backlogs of topic are more than 50000."
132      description: "Backlogs of topic {{ $labels.topic }} is more than 50000 , current value is {{ $value }}."
133
134  - alert: TooManyGeoBacklogsOnTopic
135    expr: pulsar_replication_backlog > 50000
136    for: 30s
137    labels:
138      status: warning
139    annotations:
140      summary: "Geo backlogs of topic are more than 50000."
141      description: "Geo backlogs of topic {{ $labels.topic }} is more than 50000, current value is {{ $value }}."
|
参考 #