安装esrally
|
|
 在.zshrc 中pyenv相关的环境变量
|
|
这里会遇到一个问题pyenv: no such command virtualenv-init’`,解决这个问题时需要安装插件
|
|
这里还遇到一个坑
|
|
解决办法:
|
|
sudo pacman -S tk `
2. 安装 Python 依赖
为了确保编译 Python 时包含 Tkinter 支持,安装以下依赖项:
|
|
-
可以查看集群状态
-
curl -u “elastic:123456” -k https://10.7.20.26:35919
-
{
-
“name” : “elasticsearch-es-data-nodes-0”,
-
“cluster_name” : “elasticsearch”,
-
“cluster_uuid” : “caWatVXyQmSNDLQ7lEO7qg”,
-
“version” : {
-
“number” : “7.2.0”,
-
“build_flavor” : “default”,
-
“build_type” : “docker”,
-
“build_hash” : “508c38a”,
-
“build_date” : “2019-06-20T15:54:18.811730Z”,
-
“build_snapshot” : false,
-
“lucene_version” : “8.0.0”,
-
“minimum_wire_compatibility_version” : “6.8.0”,
-
“minimum_index_compatibility_version” : “6.0.0-beta1”
-
},
-
“tagline” : “You Know, for Search”
-
}
配置es.sh
|
|
|
|
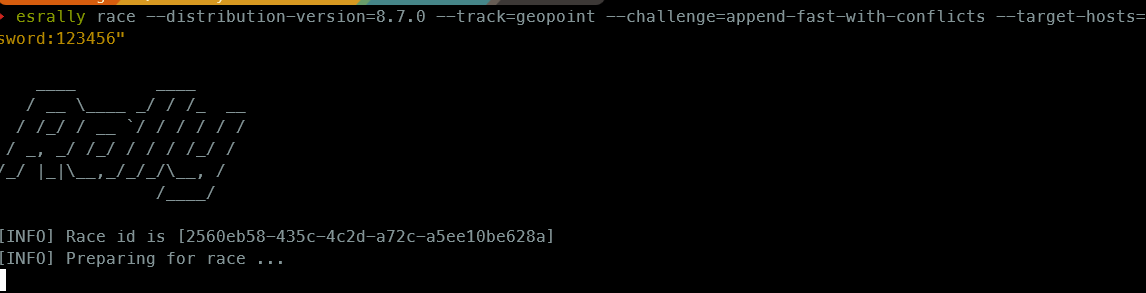
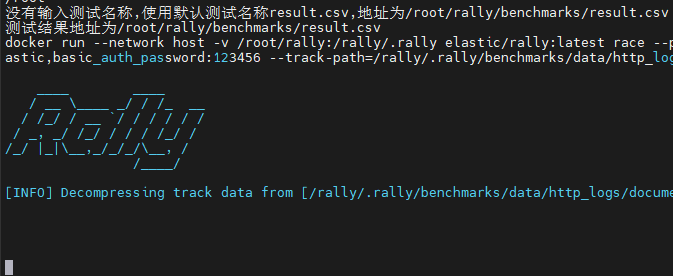
查看执行过程
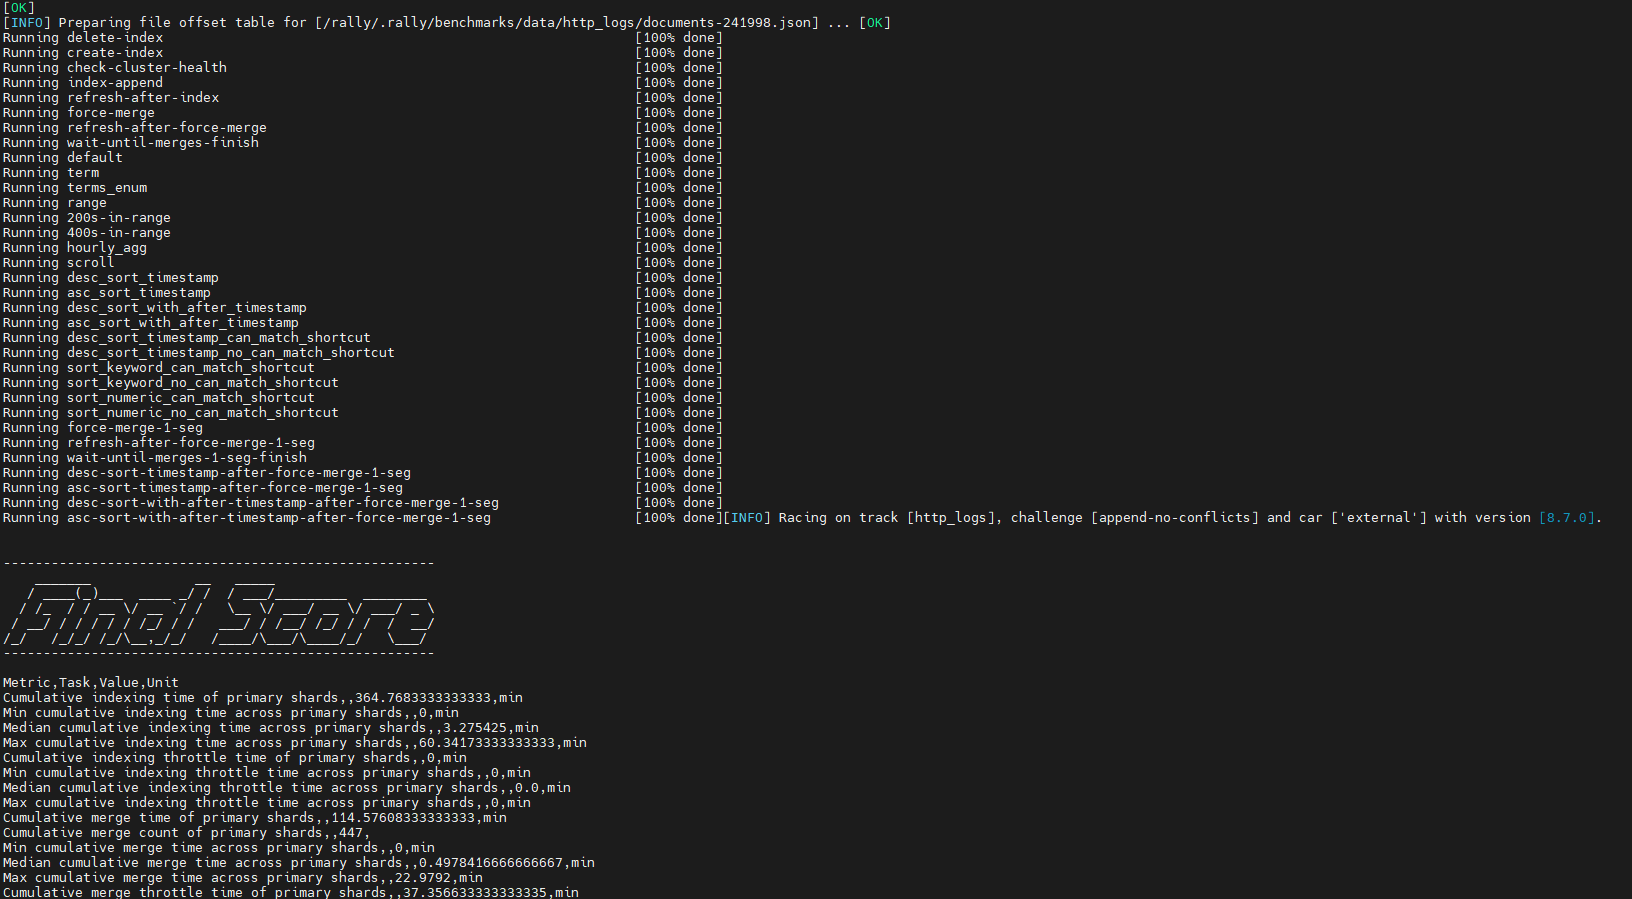
当出现这个时,就代表运行成功
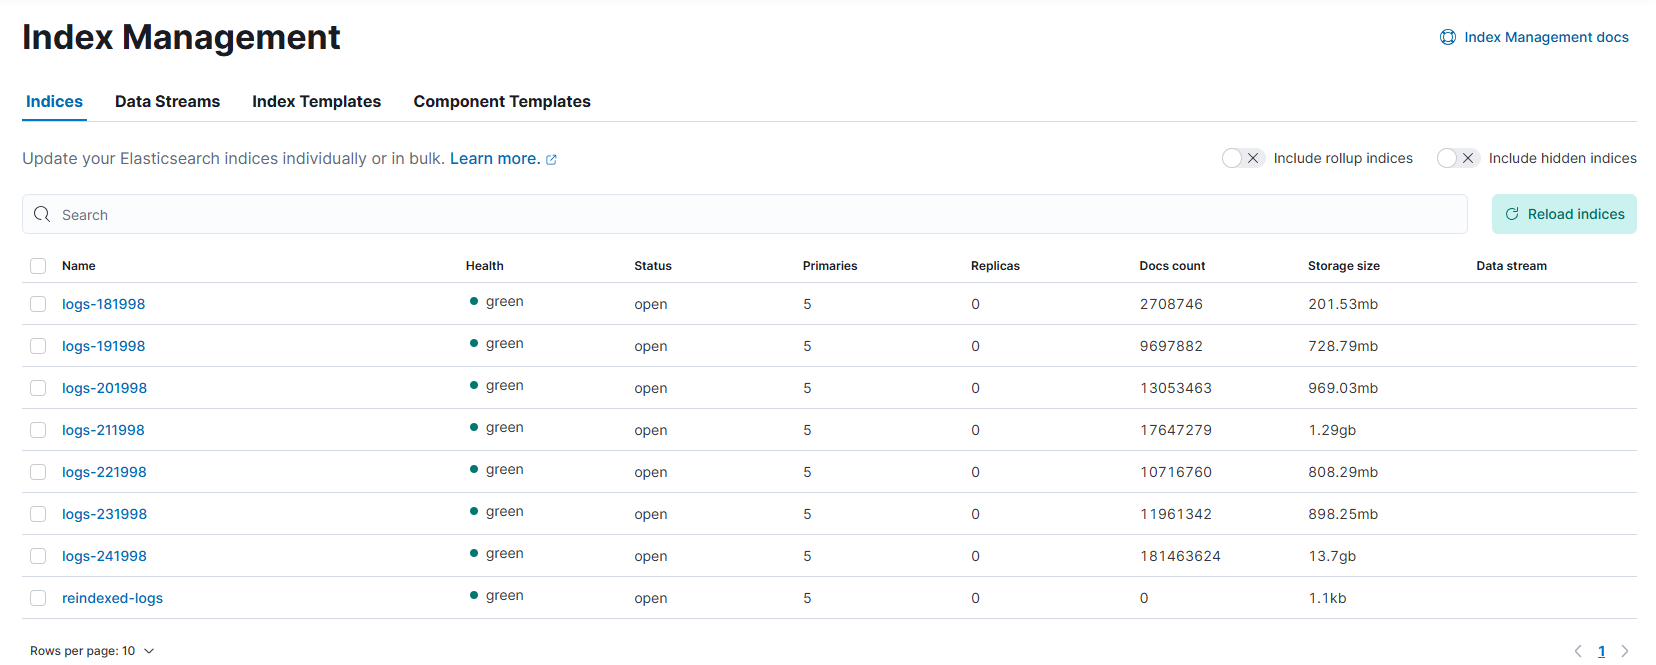
 在kibana上查看一下数据集
压测完成之后又很多性能指标,一般要关注的数据有:
throughput 每个操作的吞吐量,比如 index、search等 latency 每个操作的响应时长数据 Heap used for x 记录堆栈的使用情况 Metric 中文翻译 Task Value Unit 备注 Cumulative indexing time of primary shards 主分片累计索引时间 13.36938333 min 越小越好 Min cumulative indexing time across primary shards 跨分片累计索引最小时间 0 min 越小越好 Median cumulative indexing time across primary shards 跨分片累计索引中位时间 min 越小越好 Max cumulative indexing time across primary shards 跨分片累计索引最大时间 min 越小越好 Cumulative indexing throttle time of primary shards 主分片累计节流索引时间 0 min 越小越好 Min cumulative indexing throttle time across primary shards 跨分片累计节流最小索引时间 0 min 越小越好 Median cumulative indexing throttle time across primary shards 跨分片累计节流中位索引时间 0 min 越小越好 Max cumulative indexing throttle time across primary shards 跨分片累计节流最大索引时间 0 min 越小越好 Cumulative merge time of primary shards 主分片累积合并时间 4.2677 min 越小越好 Cumulative merge count of primary shards 主分片累积合并次数 57 越小越好 Min cumulative merge time across primary shards 跨主分片累积最小合并时间 0 min 越小越好 Median cumulative merge time across primary shards 跨主分片累积中位合并时间 1.348033333 min 越小越好 Max cumulative merge time across primary shards 跨主分片累积最大合并时间 1.464033333 min 越小越好 Cumulative merge throttle time of primary shards 主分片累计节流合并时间 1.065866667 min 越小越好 Min cumulative merge throttle time across primary shards 主分片累计节流最小合并时间 0 min 越小越好 Median cumulative merge throttle time across primary shards 主分片累计节流中位合并时间 0.328816667 min 越小越好 Max cumulative merge throttle time across primary shards 主分片累计节流最大合并时间 0.3759 min 越小越好 Cumulative refresh time of primary shards 主分片累积refresh时间 0.798716667 min 越小越好 Cumulative refresh count of primary shards 主分片累积refresh次数 320 越小越好 Min cumulative refresh time across primary shards 主分片累积最小refresh时间 1.67E-05 min 越小越好 Median cumulative refresh time across primary shards 主分片累积中位refresh时间 0.250933333 min 越小越好 Max cumulative refresh time across primary shards 主分片累积最大refresh时间 0.266416667 min 越小越好 Cumulative flush time of primary shards 主分片累积flush时间 0.584383333 min 越小越好 Cumulative flush count of primary shards 主分片累积flush次数 46 越小越好 Min cumulative flush time across primary shards 主分片累积最小flush时间 0 min 越小越好 Median cumulative flush time across primary shards 主分片累积中位flush时间 0.159566667 min 越小越好 Max cumulative flush time across primary shards 主分片累积最大flush时间 0.1632 min 越小越好 Total Young Gen GC time Young GC总时间 4.179 s 越小越好 Total Young Gen GC count Young GC总次数 961 越小越好 Total Old Gen GC time Old GC总时间 0.221 s 越小越好 Total Old Gen GC count Old GC总次数 4 越小越好 Store size 存储大小 3.018052787 GB 越小越好 Translog size Translog大小 4.10E-07 GB 越小越好 Heap used for segments segments使用的堆内内存 0.461437225 MB 越小越好 Heap used for doc values doc values使用的堆内内存 0.021503448 MB 越小越好 Heap used for terms terms使用的堆内内存 0.356811523 MB 越小越好 Heap used for norms norms使用的堆内内存 0.048034668 MB 越小越好 Heap used for points points使用的堆内内存 0 MB 越小越好 Heap used for stored fields stored fields使用的堆内内存 0.035087585 MB 越小越好 Segment count Segment数量 71 越小越好 error rate index-append 0 % Min Throughput 最小吞吐率 index-stats 90.02 ops/s 越大越好 Mean Throughput 平均吞吐率 index-stats 90.03 ops/s 越大越好 Median Throughput 中位吞吐率 index-stats 90.03 ops/s 越大越好 Max Throughput 最大吞吐率 index-stats 90.06 ops/s 越大越好 50th percentile latency 提交请求和收到完整回复之间的时间段(50%的请求该时间以内) index-stats 2.688714827 ms 越小越好 90th percentile latency index-stats 3.594806814 ms 99th percentile latency index-stats 6.877146151 ms 99.9th percentile latency index-stats 12.57476813 ms 100th percentile latency index-stats 19.47905542 ms 50th percentile service time index-stats 1.454657991 ms 90th percentile service time index-stats 1.97627194 ms 99th percentile service time index-stats 5.543909213 ms 99.9th percentile service time index-stats 10.26782569 ms 100th percentile service time index-stats 18.59820995 ms error rate index-stats 0 % Min Throughput node-stats 90.02 ops/s Mean Throughput node-stats 90.05 ops/s Median Throughput node-stats 90.04 ops/s Max Throughput node-stats 90.14 ops/s 50th percentile latency node-stats 2.815647516 ms 90th percentile latency node-stats 4.044909403 ms 99th percentile latency node-stats 5.212370545 ms 99.9th percentile latency node-stats 6.852936187 ms 100th percentile latency node-stats 6.934299599 ms 50th percentile service time node-stats 1.92963396 ms 90th percentile service time node-stats 2.280614187 ms 99th percentile service time node-stats 4.373069127 ms 99.9th percentile service time node-stats 5.121724201 ms 100th percentile service time node-stats 5.12892101 ms error rate node-stats 0 % Min Throughput default 50.02 ops/s Mean Throughput default 50.04 ops/s Median Throughput default 50.04 ops/s Max Throughput default 50.07 ops/s 50th percentile latency default 3.442207992 ms 90th percentile latency default 4.541033355 ms 99th percentile latency default 5.171663366 ms 99.9th percentile latency default 9.028199148 ms 100th percentile latency default 9.637624957 ms 50th percentile service time default 2.594712481 ms 90th percentile service time default 3.050701669 ms 99th percentile service time default 3.448219185 ms 99.9th percentile service time default 8.483097347 ms 100th percentile service time default 9.405504912 ms error rate default 0 % Min Throughput term 100.01 ops/s Mean Throughput term 100.02 ops/s Median Throughput term 100.02 ops/s Max Throughput term 100.04 ops/s 50th percentile latency term 3.199955565 ms 90th percentile latency term 4.159100866 ms 99th percentile latency term 9.006197074 ms 99.9th percentile latency term 20.99158259 ms 100th percentile latency term 21.52055805 ms 50th percentile service time term 2.48551101 ms 90th percentile service time term 3.239720117 ms 99th percentile service time term 7.17226712 ms 99.9th percentile service time term 15.9544915 ms 100th percentile service time term 19.73530301 ms error rate term 0 % Min Throughput phrase 109.99 ops/s Mean Throughput phrase 110 ops/s Median Throughput phrase 110 ops/s Max Throughput phrase 110.01 ops/s 50th percentile latency phrase 3.169040603 ms 90th percentile latency phrase 3.634604893 ms 99th percentile latency phrase 4.35058805 ms 99.9th percentile latency phrase 16.27933249 ms 100th percentile latency phrase 17.08333869 ms 50th percentile service time phrase 2.451517503 ms 90th percentile service time phrase 2.724279161 ms 99th percentile service time phrase 3.216251438 ms 99.9th percentile service time phrase 9.749228635 ms 100th percentile service time phrase 15.46012098 ms error rate phrase 0 % Min Throughput country_agg_uncached 3 ops/s Mean Throughput country_agg_uncached 3 ops/s Median Throughput country_agg_uncached 3 ops/s Max Throughput country_agg_uncached 3 ops/s 50th percentile latency country_agg_uncached 265.1378055 ms 90th percentile latency country_agg_uncached 268.3491967 ms 99th percentile latency country_agg_uncached 282.9874858 ms 100th percentile latency country_agg_uncached 299.8582891 ms 50th percentile service time country_agg_uncached 264.1177385 ms 90th percentile service time country_agg_uncached 267.2917891 ms 99th percentile service time country_agg_uncached 282.0132841 ms 100th percentile service time country_agg_uncached 298.699945 ms error rate country_agg_uncached 0 % Min Throughput country_agg_cached 97.64 ops/s Mean Throughput country_agg_cached 98.26 ops/s Median Throughput country_agg_cached 98.32 ops/s Max Throughput country_agg_cached 98.7 ops/s 50th percentile latency country_agg_cached 2.175618487 ms 90th percentile latency country_agg_cached 3.358712979 ms 99th percentile latency country_agg_cached 3.663528312 ms 99.9th percentile latency country_agg_cached 4.533531366 ms 100th percentile latency country_agg_cached 9.735687054 ms 50th percentile service time country_agg_cached 1.210322545 ms 90th percentile service time country_agg_cached 1.381615282 ms 99th percentile service time country_agg_cached 1.652208896 ms 99.9th percentile service time country_agg_cached 3.39570541 ms 100th percentile service time country_agg_cached 9.514000965 ms error rate country_agg_cached 0 % Min Throughput scroll 20.05 pages/s Mean Throughput scroll 20.06 pages/s Median Throughput scroll 20.06 pages/s Max Throughput scroll 20.08 pages/s 50th percentile latency scroll 273.2520165 ms 90th percentile latency scroll 301.6026772 ms 99th percentile latency scroll 347.1331405 ms 100th percentile latency scroll 349.3009 ms 50th percentile service time scroll 271.233834 ms 90th percentile service time scroll 298.9778046 ms 99th percentile service time scroll 345.1081409 ms 100th percentile service time scroll 346.241483 ms error rate scroll 0 % Min Throughput expression 1.5 ops/s Mean Throughput expression 1.5 ops/s Median Throughput expression 1.5 ops/s Max Throughput expression 1.5 ops/s 50th percentile latency expression 464.535454 ms 90th percentile latency expression 470.8226439 ms 99th percentile latency expression 485.6872773 ms 100th percentile latency expression 487.582457 ms 50th percentile service time expression 463.644907 ms 90th percentile service time expression 469.5449809 ms 99th percentile service time expression 484.4586398 ms 100th percentile service time expression 486.768786 ms error rate expression 0 % Min Throughput painless_static 1.4 ops/s Mean Throughput painless_static 1.4 ops/s Median Throughput painless_static 1.4 ops/s Max Throughput painless_static 1.4 ops/s 50th percentile latency painless_static 581.6272671 ms 90th percentile latency painless_static 588.2054265 ms 99th percentile latency painless_static 597.229797 ms 100th percentile latency painless_static 601.7254018 ms 50th percentile service time painless_static 580.774506 ms 90th percentile service time painless_static 587.0630695 ms 99th percentile service time painless_static 595.7945851 ms 100th percentile service time painless_static 600.6218339 ms error rate painless_static 0 % Min Throughput painless_dynamic 1.4 ops/s Mean Throughput painless_dynamic 1.4 ops/s Median Throughput painless_dynamic 1.4 ops/s Max Throughput painless_dynamic 1.4 ops/s 50th percentile latency painless_dynamic 598.3268638 ms 90th percentile latency painless_dynamic 604.6501834 ms 99th percentile latency painless_dynamic 618.8403735 ms 100th percentile latency painless_dynamic 619.2588332 ms 50th percentile service time painless_dynamic 597.337956 ms 90th percentile service time painless_dynamic 603.6431402 ms 99th percentile service time painless_dynamic 617.5273529 ms 100th percentile service time painless_dynamic 618.3759769 ms error rate painless_dynamic 0 % Min Throughput decay_geo_gauss_function_score 1 ops/s Mean Throughput decay_geo_gauss_function_score 1 ops/s Median Throughput decay_geo_gauss_function_score 1 ops/s Max Throughput decay_geo_gauss_function_score 1 ops/s 50th percentile latency decay_geo_gauss_function_score 558.662883 ms 90th percentile latency decay_geo_gauss_function_score 566.1635245 ms 99th percentile latency decay_geo_gauss_function_score 576.7578347 ms 100th percentile latency decay_geo_gauss_function_score 577.7786931 ms 50th percentile service time decay_geo_gauss_function_score 557.0170344 ms 90th percentile service time decay_geo_gauss_function_score 565.1927938 ms 99th percentile service time decay_geo_gauss_function_score 575.6546767 ms 100th percentile service time decay_geo_gauss_function_score 576.90977 ms error rate decay_geo_gauss_function_score 0 % Min Throughput decay_geo_gauss_script_score 1 ops/s Mean Throughput decay_geo_gauss_script_score 1 ops/s Median Throughput decay_geo_gauss_script_score 1 ops/s Max Throughput decay_geo_gauss_script_score 1 ops/s 50th percentile latency decay_geo_gauss_script_score 575.896866 ms 90th percentile latency decay_geo_gauss_script_score 584.6959502 ms 99th percentile latency decay_geo_gauss_script_score 595.1810607 ms 100th percentile latency decay_geo_gauss_script_score 610.31794 ms 50th percentile service time decay_geo_gauss_script_score 574.895048 ms 90th percentile service time decay_geo_gauss_script_score 583.542251 ms 99th percentile service time decay_geo_gauss_script_score 594.0682872 ms 100th percentile service time decay_geo_gauss_script_score 608.403309 ms error rate decay_geo_gauss_script_score 0 % Min Throughput field_value_function_score 1.5 ops/s Mean Throughput field_value_function_score 1.5 ops/s Median Throughput field_value_function_score 1.5 ops/s Max Throughput field_value_function_score 1.5 ops/s 50th percentile latency field_value_function_score 217.4870086 ms 90th percentile latency field_value_function_score 221.4966101 ms 99th percentile latency field_value_function_score 256.0486869 ms 100th percentile latency field_value_function_score 263.0984769 ms 50th percentile service time field_value_function_score 216.1670045 ms 90th percentile service time field_value_function_score 220.499306 ms 99th percentile service time field_value_function_score 254.5428219 ms 100th percentile service time field_value_function_score 261.8149639 ms error rate field_value_function_score 0 % Min Throughput field_value_script_score 1.5 ops/s Mean Throughput field_value_script_score 1.5 ops/s Median Throughput field_value_script_score 1.5 ops/s Max Throughput field_value_script_score 1.5 ops/s 50th percentile latency field_value_script_score 287.0456218 ms 90th percentile latency field_value_script_score 290.0809773 ms 99th percentile latency field_value_script_score 298.1395952 ms 100th percentile latency field_value_script_score 312.1123726 ms 50th percentile service time field_value_script_score 285.789164 ms 90th percentile service time field_value_script_score 288.8581588 ms 99th percentile service time field_value_script_score 296.5342737 ms 100th percentile service time field_value_script_score 311.1719809 ms error rate field_value_script_score 0 % Min Throughput large_terms 1.1 ops/s Mean Throughput large_terms 1.1 ops/s Median Throughput large_terms 1.1 ops/s Max Throughput large_terms 1.1 ops/s 50th percentile latency large_terms 572.2508298 ms 90th percentile latency large_terms 580.3001306 ms 99th percentile latency large_terms 620.8813236 ms 100th percentile latency large_terms 626.353689 ms 50th percentile service time large_terms 563.7678955 ms 90th percentile service time large_terms 572.1782421 ms 99th percentile service time large_terms 613.3370135 ms 100th percentile service time large_terms 617.420621 ms error rate large_terms 0 % Min Throughput large_filtered_terms 1.1 ops/s Mean Throughput large_filtered_terms 1.1 ops/s Median Throughput large_filtered_terms 1.1 ops/s Max Throughput large_filtered_terms 1.1 ops/s 50th percentile latency large_filtered_terms 589.2866509 ms 90th percentile latency large_filtered_terms 593.4173963 ms 99th percentile latency large_filtered_terms 598.5252649 ms 100th percentile latency large_filtered_terms 602.3230727 ms 50th percentile service time large_filtered_terms 581.2035115 ms 90th percentile service time large_filtered_terms 585.5575252 ms 99th percentile service time large_filtered_terms 590.5933169 ms 100th percentile service time large_filtered_terms 594.4011461 ms error rate large_filtered_terms 0 % Min Throughput large_prohibited_terms 1.1 ops/s Mean Throughput large_prohibited_terms 1.1 ops/s Median Throughput large_prohibited_terms 1.1 ops/s Max Throughput large_prohibited_terms 1.1 ops/s 50th percentile latency large_prohibited_terms 589.4530075 ms 90th percentile latency large_prohibited_terms 596.0567744 ms 99th percentile latency large_prohibited_terms 624.6372295 ms 100th percentile latency large_prohibited_terms 636.1257123 ms 50th percentile service time large_prohibited_terms 581.6967285 ms 90th percentile service time large_prohibited_terms 587.9331864 ms 99th percentile service time large_prohibited_terms 616.5220673 ms 100th percentile service time large_prohibited_terms 628.309642 ms error rate large_prohibited_terms 0 % Min Throughput desc_sort_population 1.5 ops/s Mean Throughput desc_sort_population 1.51 ops/s Median Throughput desc_sort_population 1.51 ops/s Max Throughput desc_sort_population 1.51 ops/s 50th percentile latency desc_sort_population 103.1405666 ms 90th percentile latency desc_sort_population 105.2754088 ms 99th percentile latency desc_sort_population 131.8258836 ms 100th percentile latency desc_sort_population 152.3099904 ms 50th percentile service time desc_sort_population 101.670836 ms 90th percentile service time desc_sort_population 104.0073033 ms 99th percentile service time desc_sort_population 130.6022178 ms 100th percentile service time desc_sort_population 150.8698669 ms error rate desc_sort_population 0 % Min Throughput asc_sort_population 1.5 ops/s Mean Throughput asc_sort_population 1.51 ops/s Median Throughput asc_sort_population 1.51 ops/s Max Throughput asc_sort_population 1.51 ops/s 50th percentile latency asc_sort_population 107.5372407 ms 90th percentile latency asc_sort_population 110.8386073 ms 99th percentile latency asc_sort_population 116.6895737 ms 100th percentile latency asc_sort_population 119.4045231 ms 50th percentile service time asc_sort_population 106.1783125 ms 90th percentile service time asc_sort_population 109.3649962 ms 99th percentile service time asc_sort_population 115.3436784 ms 100th percentile service time asc_sort_population 118.1872 ms error rate asc_sort_population 0 % Min Throughput asc_sort_with_after_population 1.5 ops/s Mean Throughput asc_sort_with_after_population 1.5 ops/s Median Throughput asc_sort_with_after_population 1.5 ops/s Max Throughput asc_sort_with_after_population 1.51 ops/s 50th percentile latency asc_sort_with_after_population 129.1767997 ms 90th percentile latency asc_sort_with_after_population 133.4439944 ms 99th percentile latency asc_sort_with_after_population 140.8711791 ms 100th percentile latency asc_sort_with_after_population 144.9907233 ms 50th percentile service time asc_sort_with_after_population 127.6733635 ms 90th percentile service time asc_sort_with_after_population 131.2300396 ms 99th percentile service time asc_sort_with_after_population 140.3493805 ms 100th percentile service time asc_sort_with_after_population 143.983128 ms error rate asc_sort_with_after_population 0 % Min Throughput desc_sort_geonameid 6.01 ops/s Mean Throughput desc_sort_geonameid 6.01 ops/s Median Throughput desc_sort_geonameid 6.01 ops/s Max Throughput desc_sort_geonameid 6.02 ops/s 50th percentile latency desc_sort_geonameid 6.548634556 ms 90th percentile latency desc_sort_geonameid 7.124439673 ms 99th percentile latency desc_sort_geonameid 8.067587848 ms 100th percentile latency desc_sort_geonameid 8.096768637 ms 50th percentile service time desc_sort_geonameid 5.541916529 ms 90th percentile service time desc_sort_geonameid 5.901245272 ms 99th percentile service time desc_sort_geonameid 6.820803307 ms 100th percentile service time desc_sort_geonameid 6.879838067 ms error rate desc_sort_geonameid 0 % Min Throughput desc_sort_with_after_geonameid 5.99 ops/s Mean Throughput desc_sort_with_after_geonameid 6 ops/s Median Throughput desc_sort_with_after_geonameid 6 ops/s Max Throughput desc_sort_with_after_geonameid 6 ops/s 50th percentile latency desc_sort_with_after_geonameid 142.7790278 ms 90th percentile latency desc_sort_with_after_geonameid 151.9306856 ms 99th percentile latency desc_sort_with_after_geonameid 208.632983 ms 100th percentile latency desc_sort_with_after_geonameid 211.4377066 ms 50th percentile service time desc_sort_with_after_geonameid 141.9006125 ms 90th percentile service time desc_sort_with_after_geonameid 149.5498388 ms 99th percentile service time desc_sort_with_after_geonameid 178.1799831 ms 100th percentile service time desc_sort_with_after_geonameid 210.2229249 ms error rate desc_sort_with_after_geonameid 0 % Min Throughput asc_sort_geonameid 6.02 ops/s Mean Throughput asc_sort_geonameid 6.02 ops/s Median Throughput asc_sort_geonameid 6.02 ops/s Max Throughput asc_sort_geonameid 6.02 ops/s 50th percentile latency asc_sort_geonameid 6.162967999 ms 90th percentile latency asc_sort_geonameid 6.680636853 ms 99th percentile latency asc_sort_geonameid 7.167303486 ms 100th percentile latency asc_sort_geonameid 7.649931009 ms 50th percentile service time asc_sort_geonameid 5.219853483 ms 90th percentile service time asc_sort_geonameid 5.514943344 ms 99th percentile service time asc_sort_geonameid 5.816583 ms 100th percentile service time asc_sort_geonameid 6.203371915 ms error rate asc_sort_geonameid 0 % Min Throughput asc_sort_with_after_geonameid 6 ops/s Mean Throughput asc_sort_with_after_geonameid 6 ops/s Median Throughput asc_sort_with_after_geonameid 6 ops/s Max Throughput asc_sort_with_after_geonameid 6.01 ops/s 50th percentile latency asc_sort_with_after_geonameid 130.5534603 ms 90th percentile latency asc_sort_with_after_geonameid 131.7300497 ms 99th percentile latency asc_sort_with_after_geonameid 135.3648191 ms 100th percentile latency asc_sort_with_after_geonameid 139.0438636 ms 50th percentile service time asc_sort_with_after_geonameid 129.4173571 ms 90th percentile service time asc_sort_with_after_geonameid 130.443844 ms 99th percentile service time asc_sort_with_after_geonameid 133.3877408 ms 100th percentile service time asc_sort_with_after_geonameid 137.657303 ms error rate asc_sort_with_after_geonameid 0 %
- ES优化建议
- es内存分配 当机器内存小于 64G 时,遵循通用的原则,50% 给 ES,50% 留给 lucene。 当机器内存大于 64G 时,遵循以下原则: 如果主要的使用场景是全文检索,那么建议给 ES Heap 分配 4~32G 的内存即可;其它内存留给操作系统,供 lucene 使用(segments cache),以提供更快的查询性能。 如果主要的使用场景是聚合或排序,并且大多数是 numerics,dates,geo_points 以及 not_analyzed 的字符类型,建议分配给 ES Heap 分配 4~32G 的内存即可,其它内存留给操作系统,供 lucene 使用,提供快速的基于文档的聚类、排序性能。
如果使用场景是聚合或排序,并且都是基于 analyzed 字符数据,这时需要更多的 heap size,建议机器上运行多 ES 实例,每个实例保持不超过 50% 的 ES heap 设置(但不超过 32 G,堆内存设置 32 G 以下时,JVM 使用对象指标压缩技巧节省空间),50% 以上留给 lucene。
3.2 禁止 swap 禁止 swap,一旦允许内存与磁盘的交换,会引起致命的性能问题。可以通过在 elasticsearch.yml 中 bootstrap.memory_lock: true,以保持 JVM 锁定内存,保证 ES 的性能。
3.3 es 分片建议 shard数过小不一定好,如果数据量很大,导致每个 shard 体积过大,会影响查询性能。 shard数过大也不一定好,因为 es 的每次查询是要分发给所有的 shard 来查询,然后再对结果做聚合处理,如果 shard 数过多也会影响查询性能。因此 shard 的数量需要根据自己的情况测出来。官方建议单个 shard 大小不要超过 50GB
官方文档有一节关于容量规划的章节,其给出的步骤如下: 使用生产环境的硬件配置创建单节点集群 创建一个只有一个主分片无副本的索引,设置相关的mapping信息 将真实的文档导入到步骤 2 的索引中 测试实际会用到的查询语句 测试的过程中,关注相关指标数据,比如索引性能、查询性能,如果在某一个点相关性能数据超出了你的预期值,那么此时的 shard size大小便是符合你预期的单个 shard size的大小。
- ES容量模型建议 1.【公有云 ES 最佳实践】 1.1 集群总分片数 < 30000,单个索引分片大小建议不超过 50g,单节点分片数量 < 4000 1.2 节点数超过 20 节点添加专有 master 节点,即 data:master ≤ 20:1 1.3 cpu/mem/disk 建议比例 搜索场景:比例 1:2:32 日志场景:比例 1:4:192 ~ 1:4:384 1.4 单节点性能规格参考 写入性能: 16c/64g、 jvm 32G 单节点可支持 2w docs/s 写入 存储容量 = 源数据 * (1 + 副本数量) * 1.45 * (1 + 0.5)≈ 源数据 * (1 + 副本数量)
【社区建议】 2.1 数据加速、查询聚合等场景:单节点磁盘最大容量 = 单节点内存大小(GB)* 10。 日志写入、离线分析等场景:单节点磁盘最大容量 = 单节点内存大小(GB)* 50。 通常情况:单节点磁盘最大容量 = 单节点内存大小(GB)* 30。 2.2 单个数据节点的shard数量 = 当前节点的内存大小 * 30(小规格实例参考) 单个数据节点的shard数量 = 当前节点的内存大小 * 50(大规格实例参考)
其他指标 【建议监控指标】 cpu < 60% jvm内存 < 80% 磁盘util < 60% 磁盘使用率 < 70% 集群所有index,必须至少1主 + 1从副本 集群读写拒绝率 < 0.1% 集群无节点 old gc 单节点承载最大数据量 < 1T ES版本 >= 6.8 ————————————————