💡 Introduction
In this new blog post, we build on the infrastructure and the Kafka producer introduced in the first two blog posts of our Kafka 101 Tutorial series. We simulate a company receiving sales events from its many physical stores inside its Kafka infrastructure, and we introduce the basic Apache Flink architecture to do streaming analytics on top of these sales events.
Specifically, for this use case we will aggregate sales events per store and provide the total sales amount per store per time window. The output stream of aggregated sales will then be fed back to the Kafka infrastructure - and the new data type registered in the schema registry - for downstream applications. We do a time based aggregation as this is a basic example of time based analytics one can do with Apache Flink. For this first Flink based blog post, we will be using the Flink SQL API. In a future blog post, we will look at the more powerful Java API.
🐋 Requirements
To get this project running, you will just need minimal requirements: having Docker and Docker Compose installed on your computer.
The versions I used to build the project are
|
|
If your versions are different, it should not be a big problem. Though, some of the following might raise warnings or errors that you should debug on your own.
🏭 Infrastructure
We will start by getting the infrastructure up and running on our local computer. To do so, nothing simpler! Simply type the following commands in
|
|
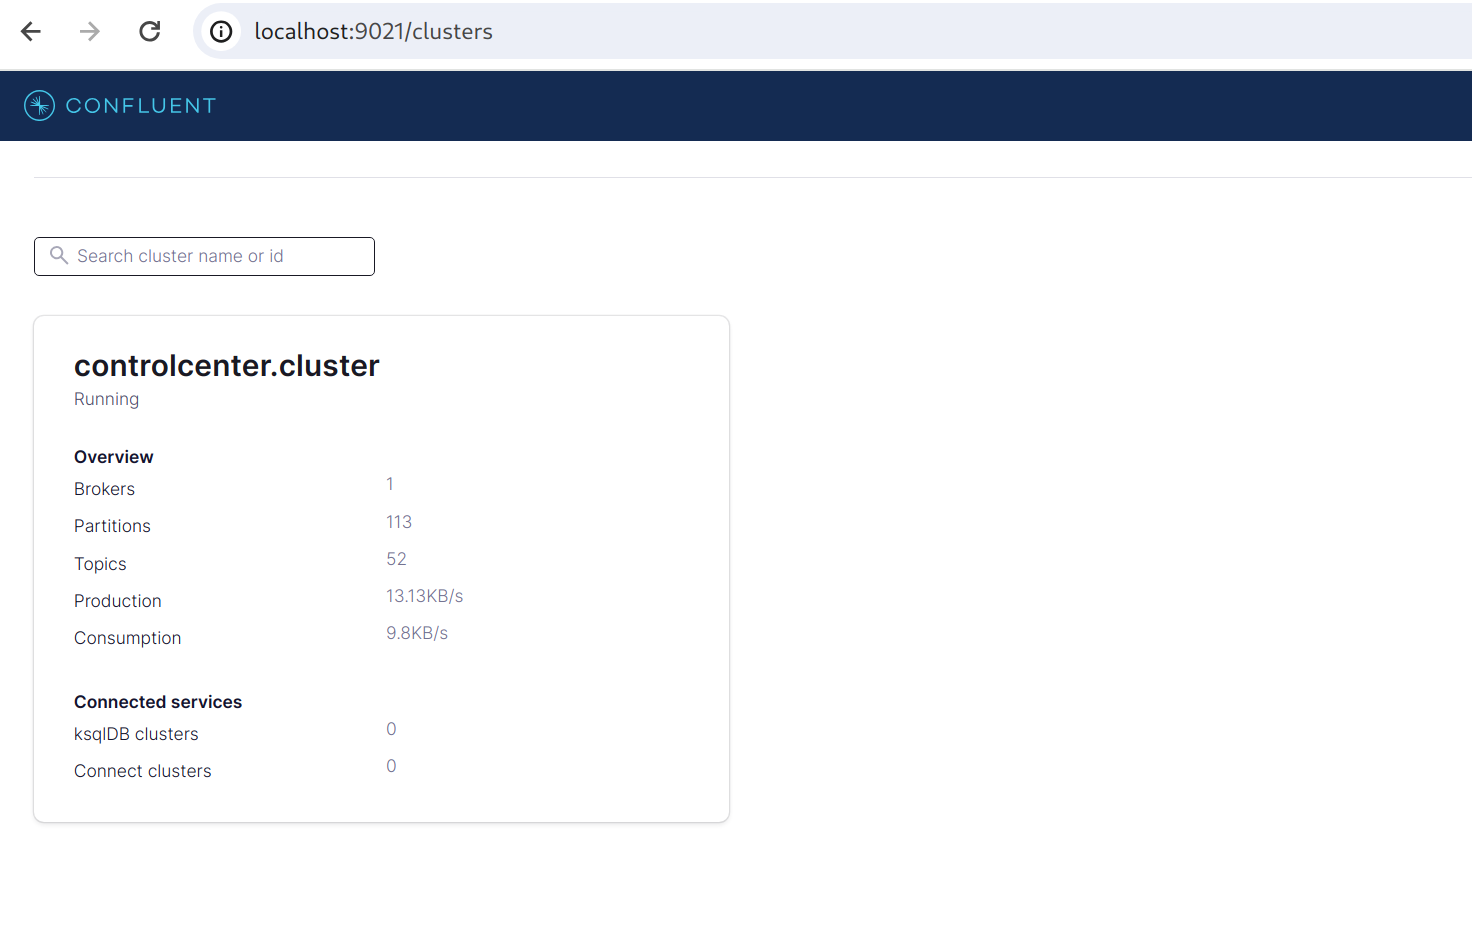
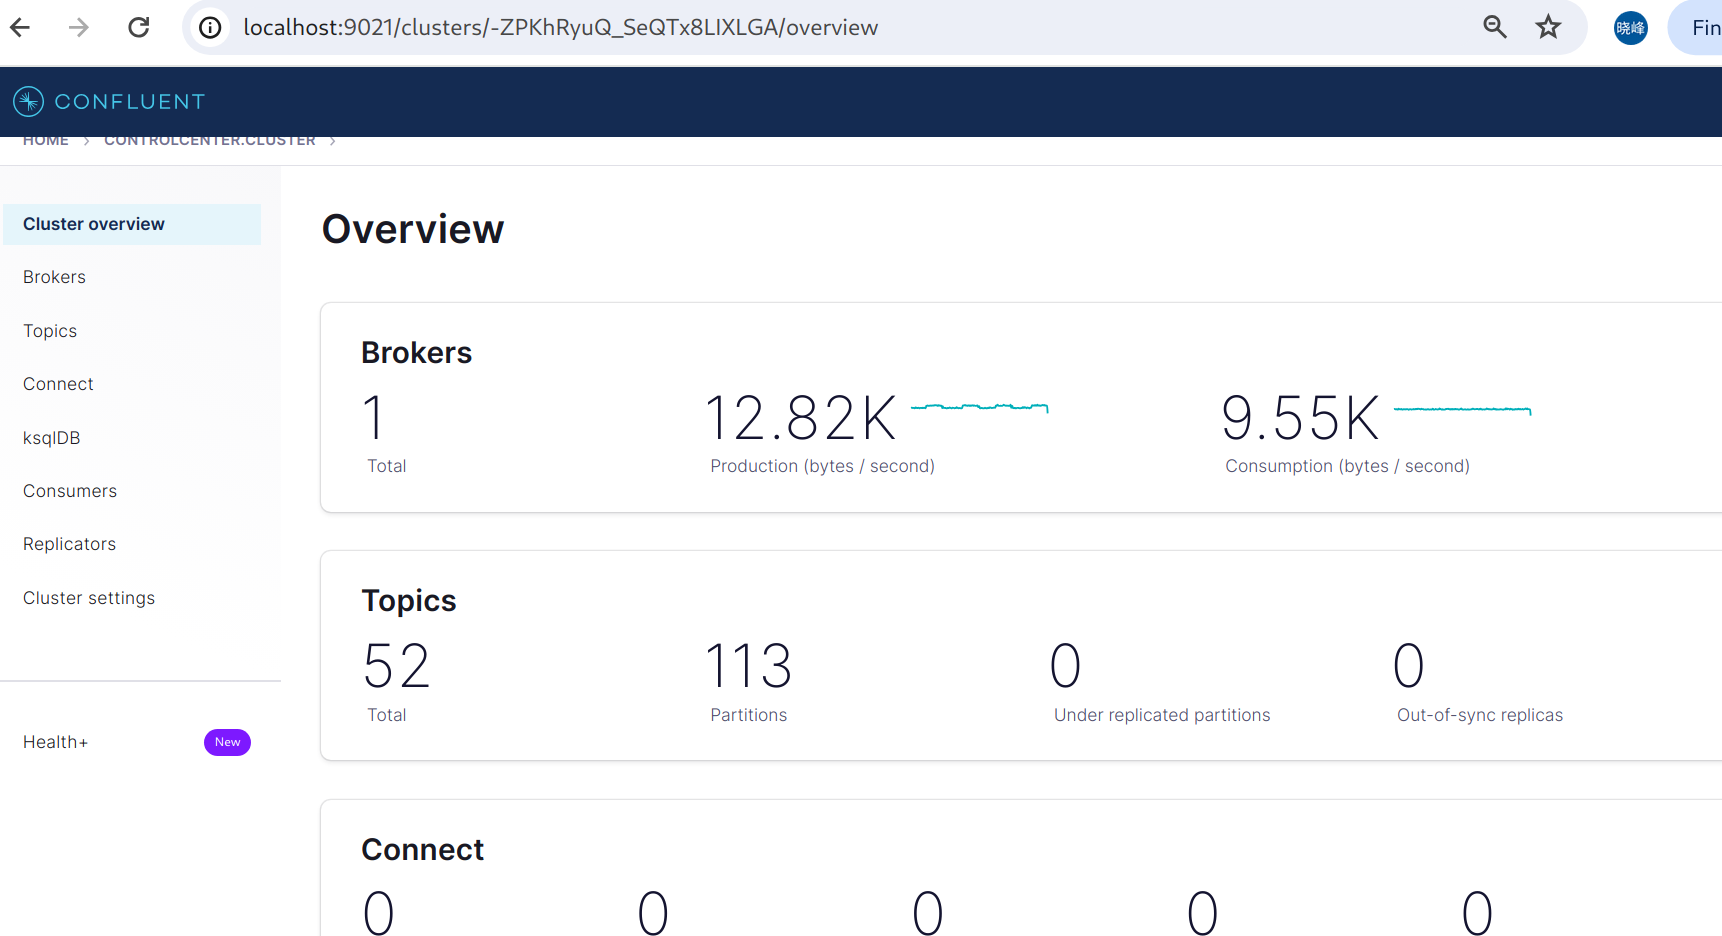
This will bring up the Kafka infrastructure we are familiar with, as well as the Kafka sales producer we introduced in our latest blog post. The producer starts producing immediately at a frequency of 1 message per second. You can check that everything is running properly by navigating to the Confluent Control Center UI on localhost:9021. Then go to the Topics tab and click the SALES topic. This is the topic the Kafka producer is producing to. You should see something similar to the following.
The jobmanager container supports the Flink Job Manager, and the taskmanager the Flink Task Manager. For a reminder or a crash course about the Flink architecture, check this link. Basically, a Flink cluster is composed of a job manager and one or multiple task managers. The job manager is responsible for distributing the work to the task managers, and task managers do the actual work.
The third service - sql-client - is the SQL client that will allow us to submit SQL jobs to our Flink cluster. In a typical production environment, Flink jobs will be designed using the Java/Scala API, and there is no need for the SQL client. For test cases, this SQL client remains convenient.
Flink ships with a very nice UI. You can access it on localhost:18081. If you follow this link, you should see something like the following
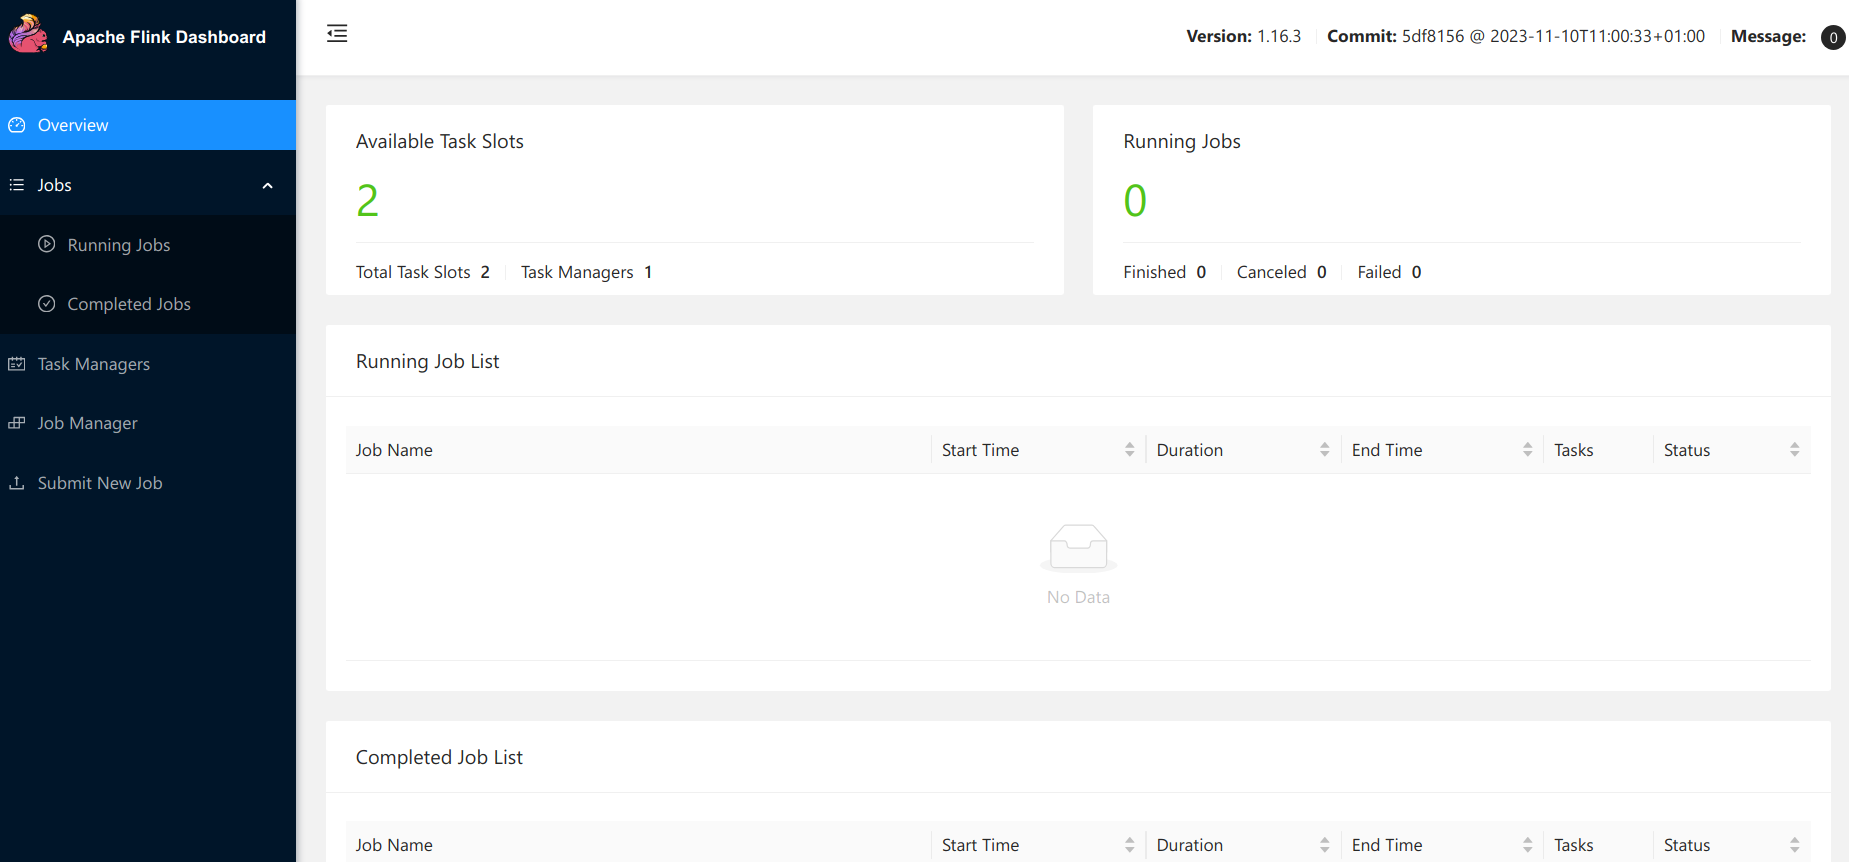
You can see that 1 task manager is registered - since we started a single task manager container - with 2 available task slots and 0 running job. There are 2 task slots as we specifically created 1 task manager with 2 task slots - taskmanager.numberOfTaskSlots: 2 config in the taskmanager - totalling to 2 task slots.
⚡ Let’s do some streaming analytics
Now that everything is up and running is time to showcase the power of Apache Flink.
As a reminder, we have a Kafka producer producing fake sales records for 3 stores, every second. One possible analytics would be to aggregate the total sales per store to compare which stores make more sales than others. And because why not, let us aggregate per 1-minute time window as well, using tumbling windows. Tumbling windows have a fixed time length and do not overlap. The picture from Flink documentation illustrates this very well.
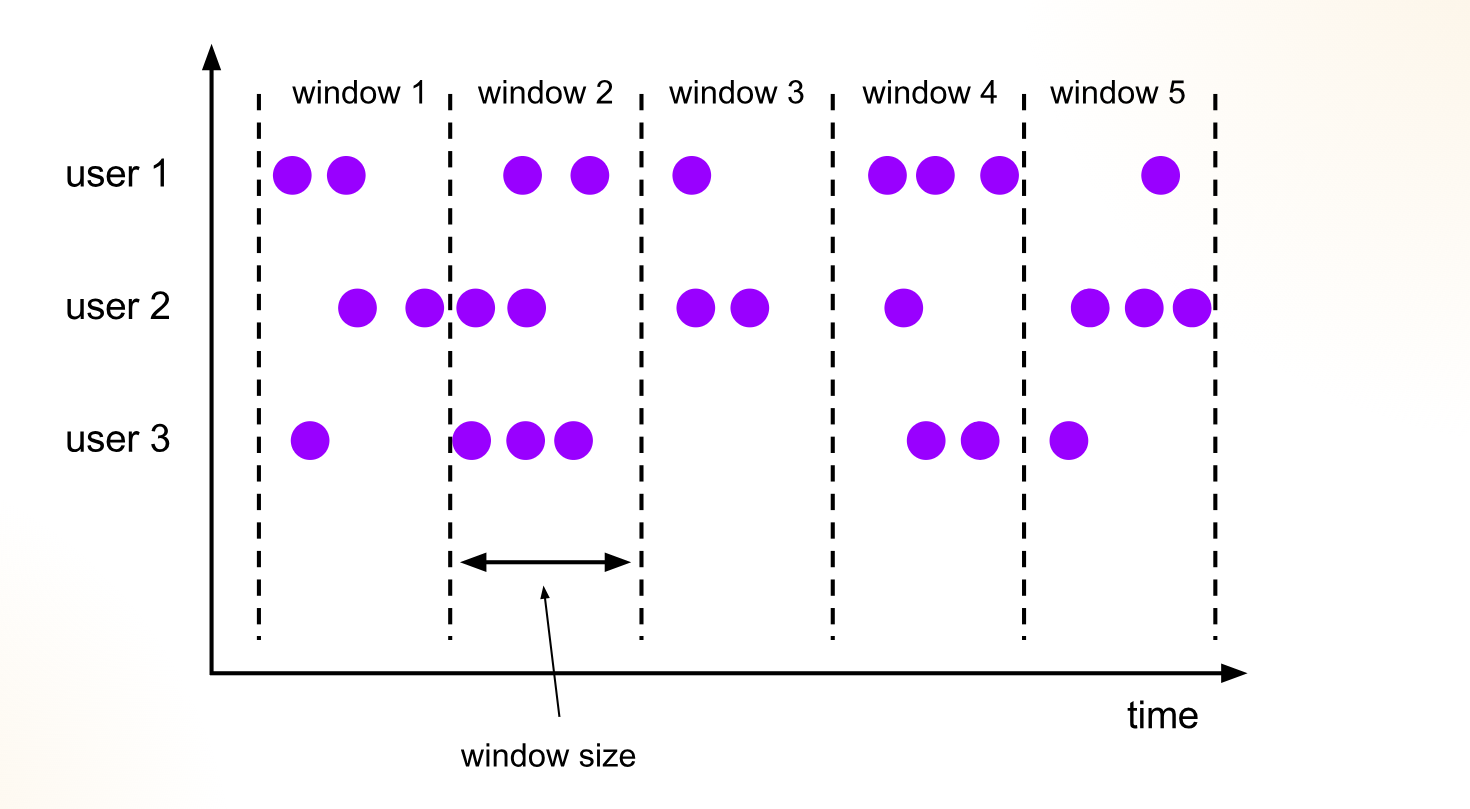
Our output stream from Flink will be 1 data point per store per minute. For this specific use case, we will feed the data stream back to Kafka in a new topic, but Flink also supports sinking to a SQL database for example, or also custom sinks such as a Redis sink; depends on the requirements. I like sinking back to Kafka to have a centralized stream catalog, I find it easier on the consumer/downstream side.
The logic is implemented in a .sql file. Source and sink tables are created, and then the logic is very simple for this use case
|
|
This very simple SQL expression tells Flink to assign sales events to time buckets (those 1-minute-wide tumbling windows), and to then compute the total sales per store_id per window_start timestamp.
We are using the actual timestamps of the sales events to measure time and group observations; this is refered to as event time in Flink. Flink supports another type of time to keep track of time and ordered events: processing time. With event time, events flowing into Flink carry their timestamps (like the exact timestamps when the sales happened).
🐿 Start the Flink job
To start the Flink job, we need to enter the sql-client container and start the job manually by passing the .sql file. To start the job, type the following commands
|
|
The SQL client should then show the following output

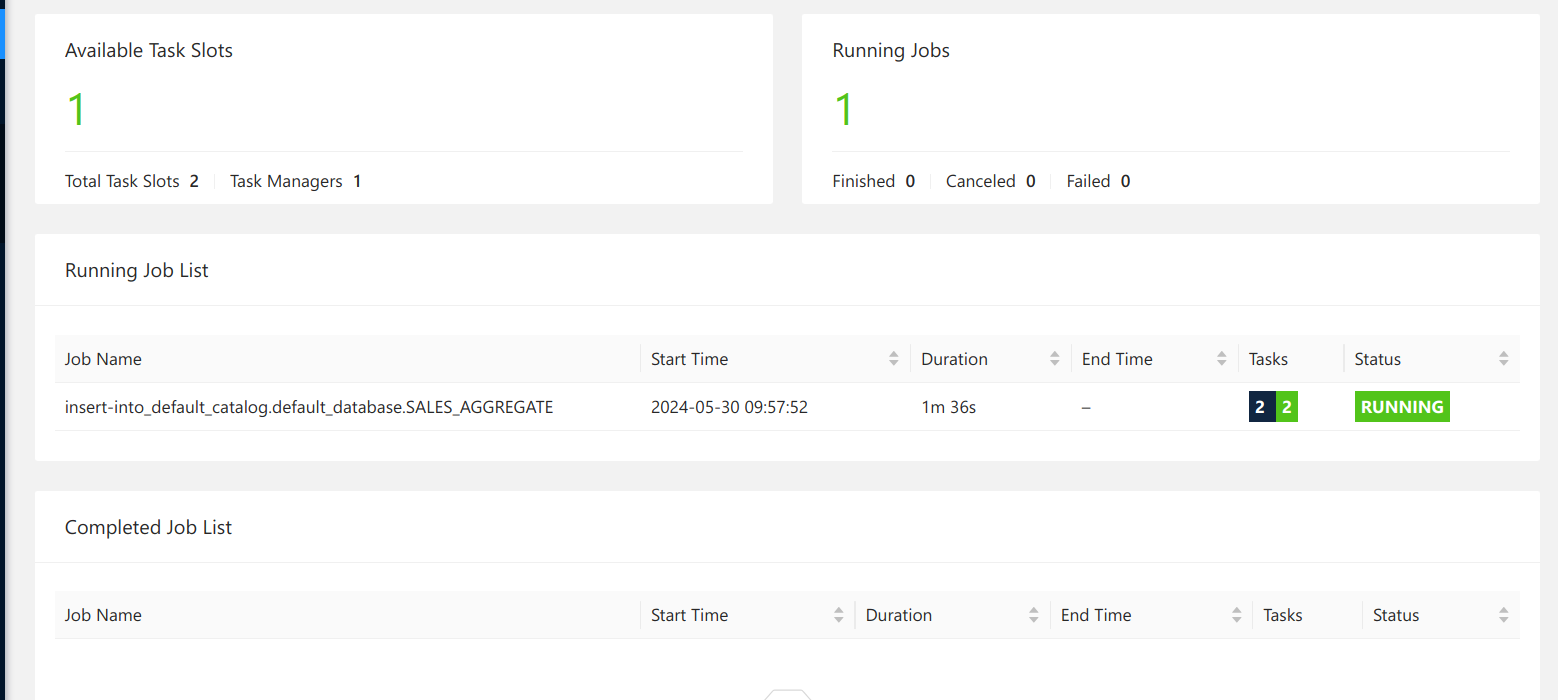
where the Job ID would be different for you, as it is randomly generated. We can also see that the job is running by going to the Flink UI on localhost:18081.
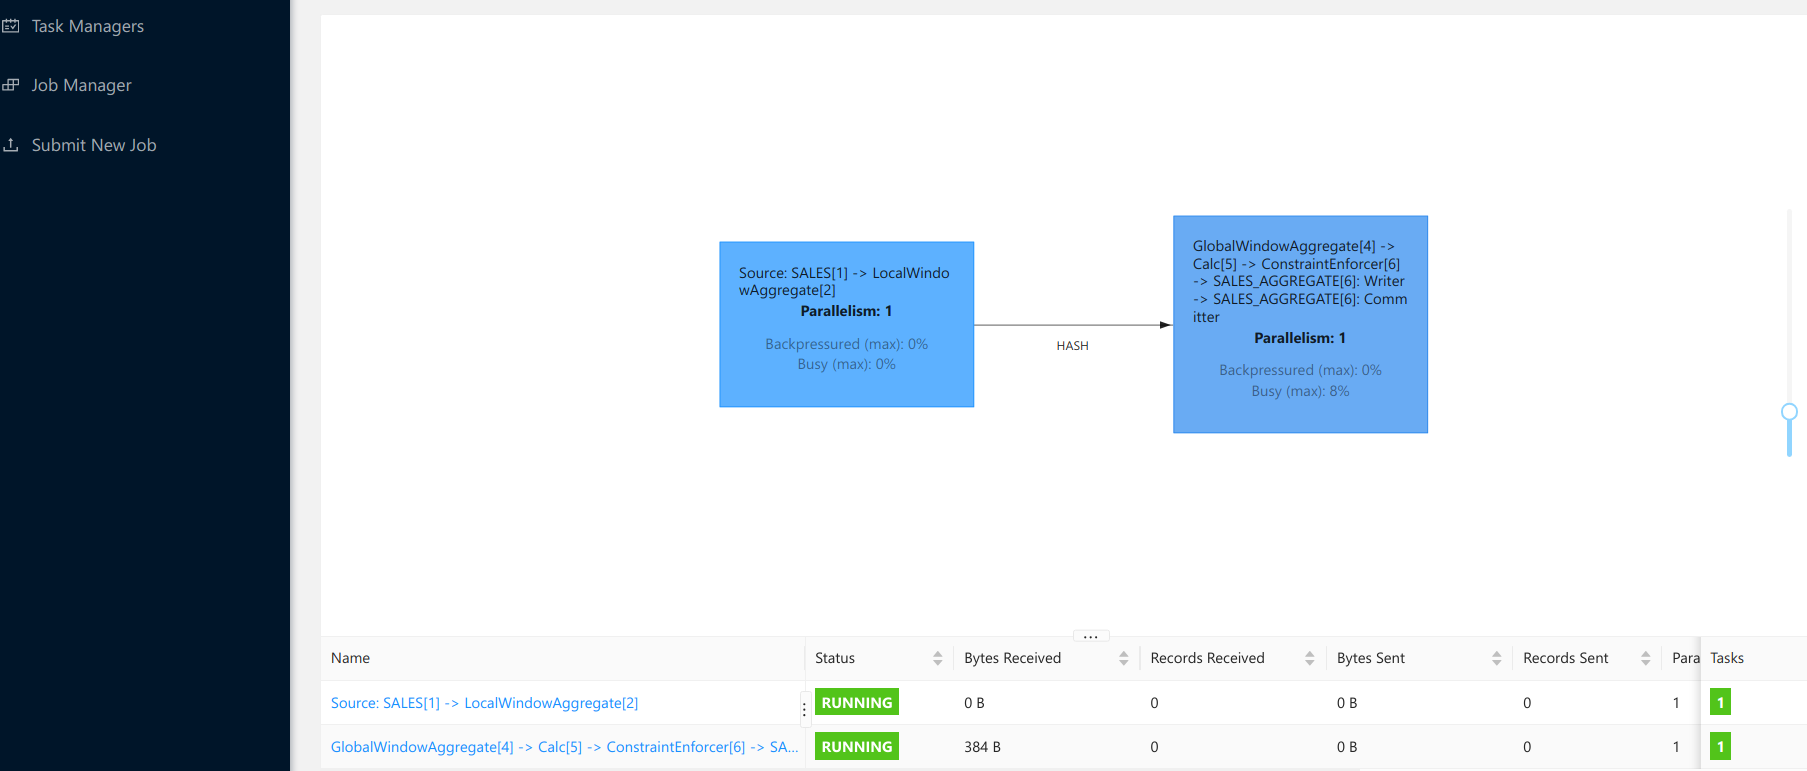
You can see the job running on the main view of the UI, and then see more details about the running job.
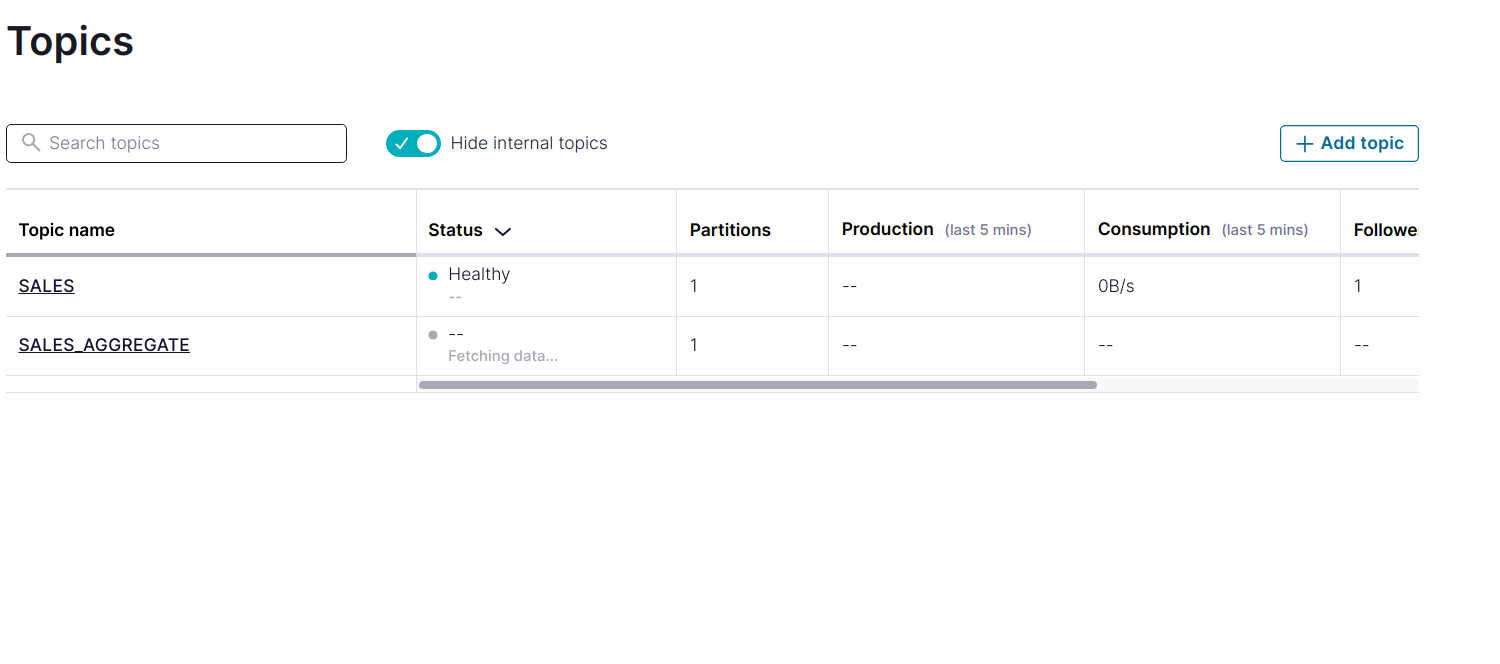
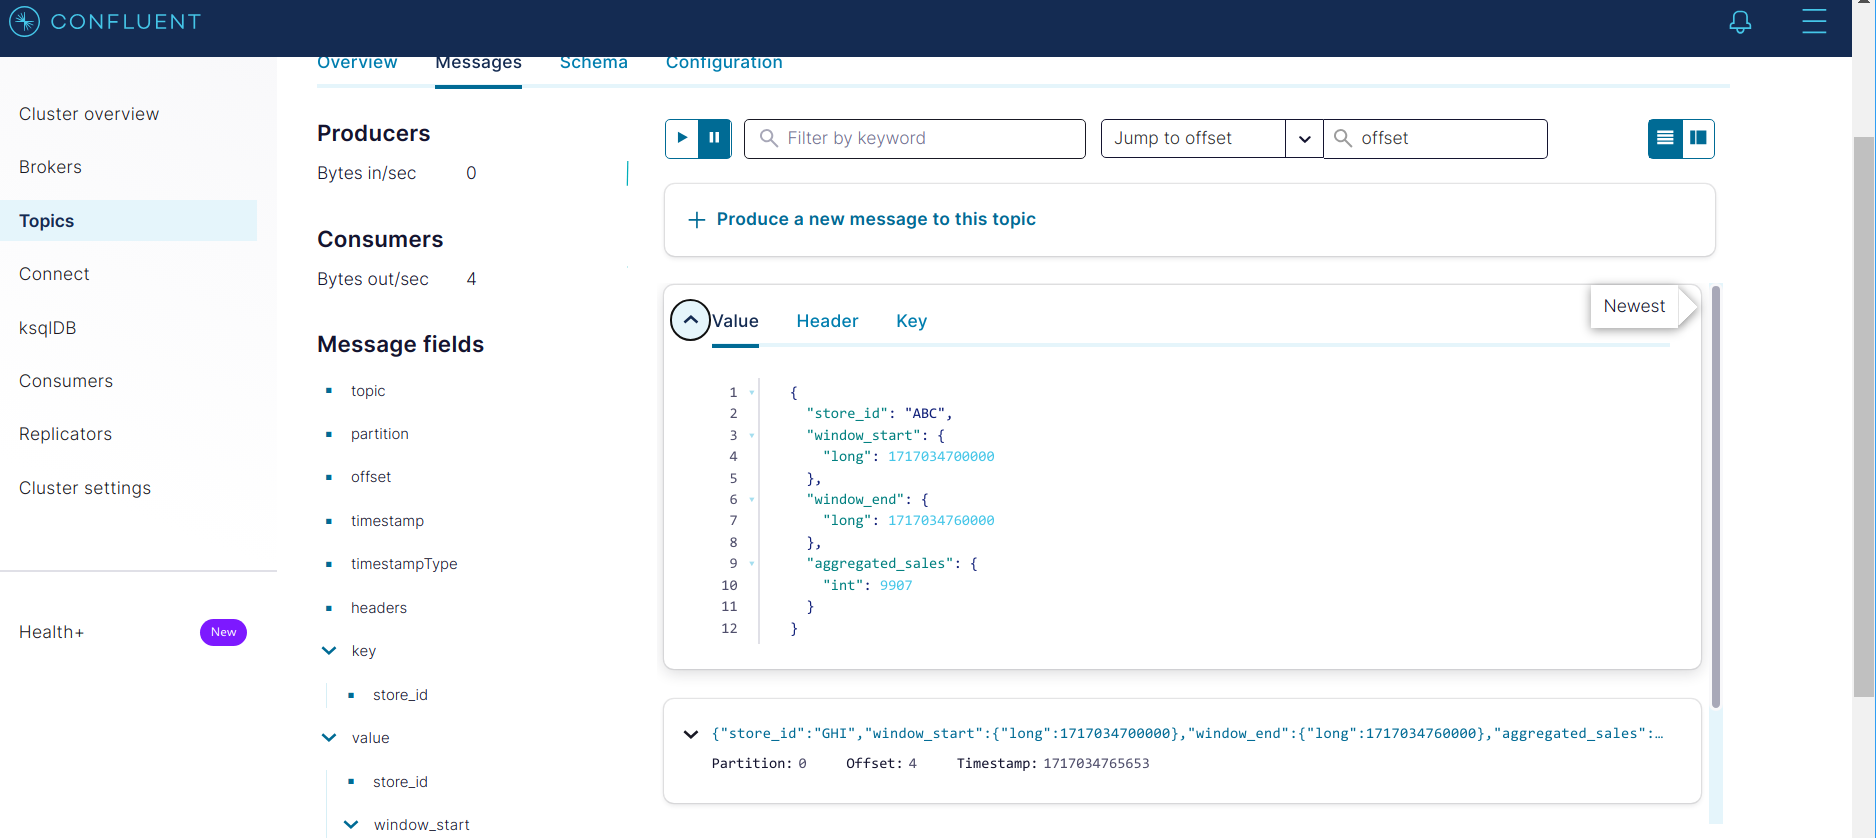
Finally, to close the loop, let us check that our output stream is indeed sinked to Kafka! Flink writes - produces - to the SALES_AGGREGATE topic. The topic is automatically created when Flink starts producing to it - as we allowed automatic topic creation on our Kafka cluster - and the corresponding schemas are registered in the schema registry. Go to the Confluent Control Center at localhost:9021 and navigate to the Topics tab and then to the SALES_AGGREGATE. You should see messages being published every minute - as this is the length of our aggregating window.
注意,我们需要启动 myproudcer 进行发送数据才可以,因为 60s 一个窗口。
☠ Tear the infrastructure down
Once we are done playing around with our toy example, it is easy to stop all processes. Simply type the following command
|
|